
Figure 1.
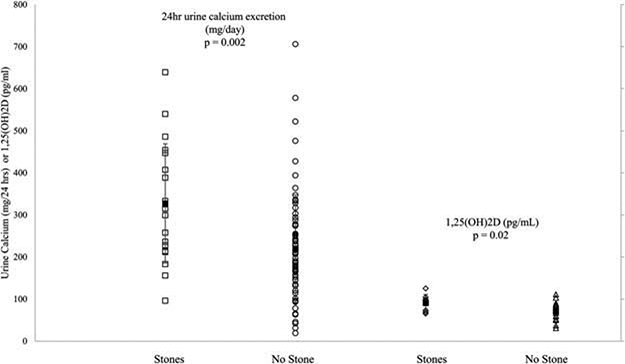
Scatter plots showing mean differences in 24-hour urinary calcium excretion and 1,25(OH)2D levels between stone formers and non-stone formers. The error bars denote ± standard deviation.
Official websites use .gov
A
.gov website belongs to an official
government organization in the United States.
Secure .gov websites use HTTPS
A lock (
) or https:// means you've safely
connected to the .gov website. Share sensitive
information only on official, secure websites.
Scatter plots showing mean differences in 24-hour urinary calcium excretion and 1,25(OH)2D levels between stone formers and non-stone formers. The error bars denote ± standard deviation.