
Figure 3.
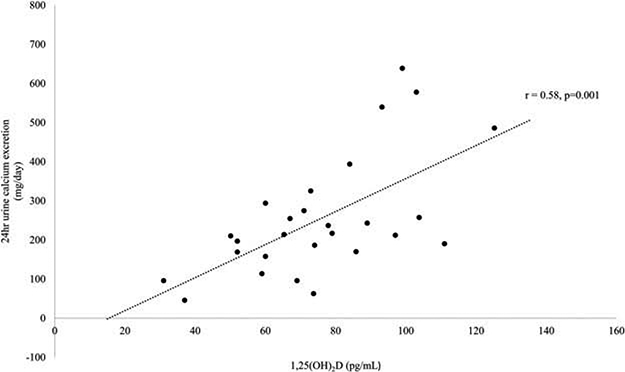
Scatter plot indicating the correlation between serum 1,25(OH)2D levels and 24-hour urinary calcium excretion (r = 0.58, p = 0.001).
Official websites use .gov
A
.gov website belongs to an official
government organization in the United States.
Secure .gov websites use HTTPS
A lock (
) or https:// means you've safely
connected to the .gov website. Share sensitive
information only on official, secure websites.
Scatter plot indicating the correlation between serum 1,25(OH)2D levels and 24-hour urinary calcium excretion (r = 0.58, p = 0.001).