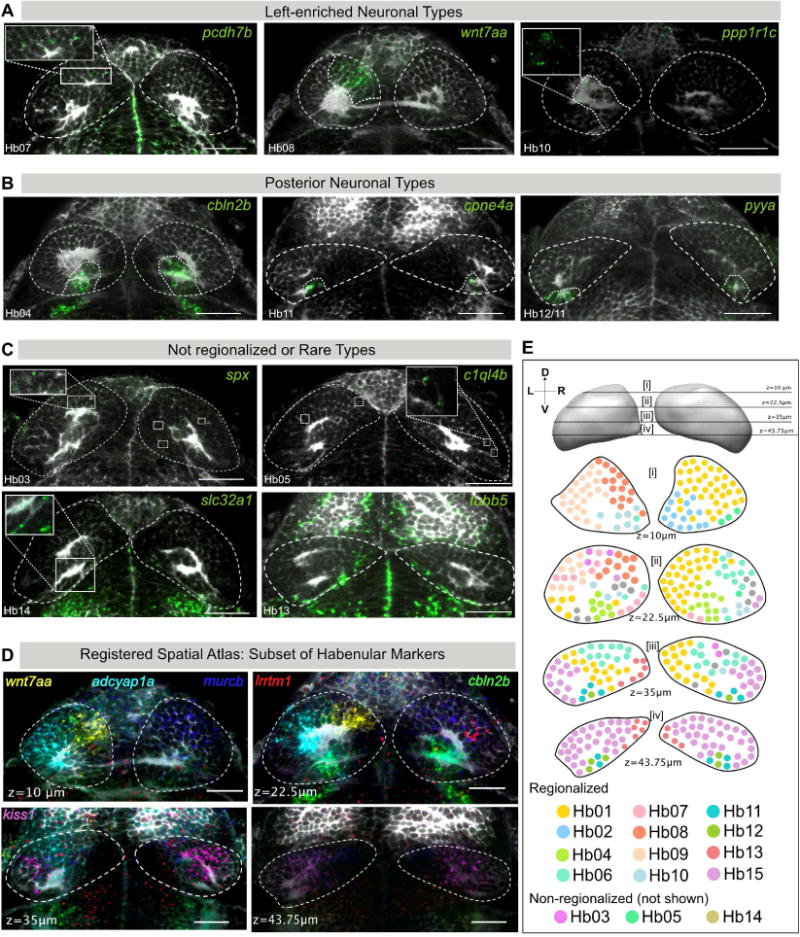
Figure 3. Validation and Spatial Distribution of 10 Novel Habenular Neuronal Types.

A–J. RNA-FISH (green) was performed for specific markers for novel clusters A) Left-enriched clusters: Hb07 (pcdh7b), Hb08 (wnt7aa), Hb10 (ppp1r1c); B) Posterior habenular clusters: Hb04 (cbln2b), Hb11 (cpne4a), Hb12/11 (pyya), C) Non-regionalized or rare neuronal types: Hb03 (spx), Hb05 (c1ql4b), Hb14 (slc32a1), and Hb13 (tubb5), each overlaid with a total-Erk co-stain (pale gray) for registration. In each case, representative habenular slices with expression are shown. Full stacks are available through a linked website [See Data Availability Section].
D. Slices through the registered reference habenula simultaneously showing six marker genes that are expressed in a regionalized pattern: wnt7aa (La_Hb08), adcyap1a (La_Hb07), cbln2b (La_Hb04), murcb (La_Hb01), lrrtm1 (La_Hb06), gpr139 (La_Hb15).
E. Schematic of representative transverse slices through the habenula displaying rough spatial co-ordinates of previously described as well as new neuronal types found by single-cell analysis. Cells are color-coded based on their identity in the t-SNE plot (see Figure 1C). Depth is indicated by the z slice in microns. The sectioning extends from z = μm (Dorsal) and z = 75μm (Ventral). Only regionalized markers are represented. Schematic is a simplified representation of an accompanying stack of registered habenular markers overlaid onto one another [see Movie S1]. Scale bars indicate 50 μm.
