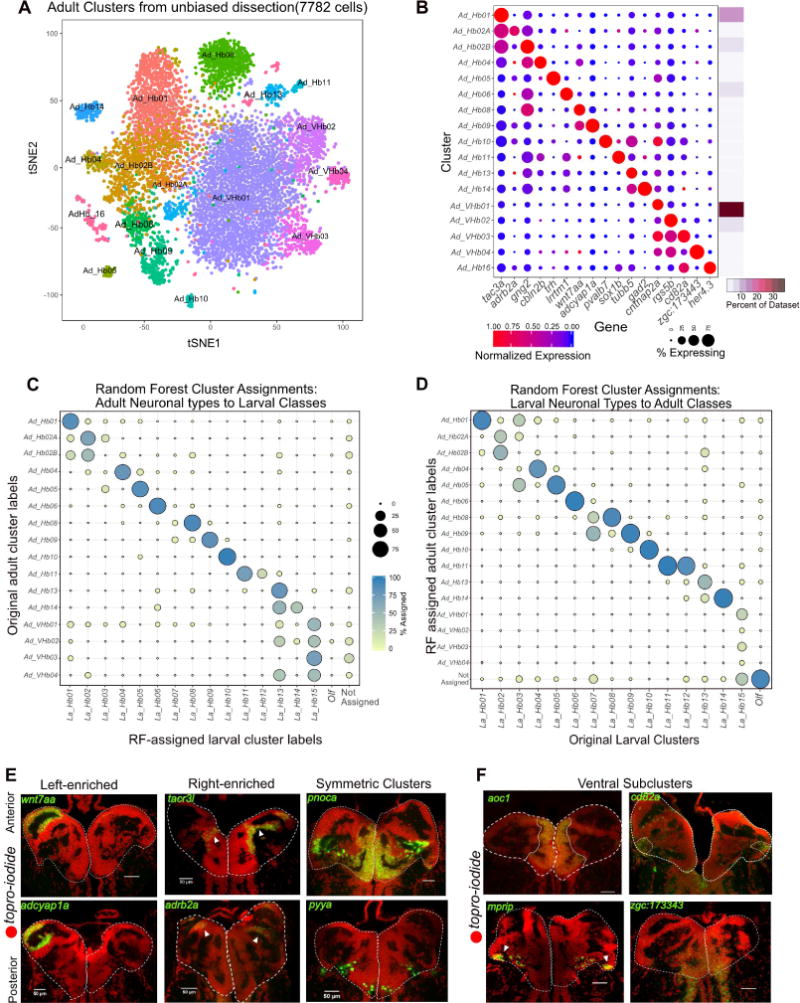
Figure 5. Comparative Analysis of Habenular Neuronal Types between Larval and Adult Stages.

A. t-SNE visualization of adult single cell clusters obtained by clustering of the adult dataset. Clusters have been labeled post hoc after comparison to the larval dataset (See Figures 5C and 5D).
B. Gene Expression profiles (columns) of select cluster-specific markers identified through differential expression analysis (DEA) across all adult clusters. Bar on the right displays percent of total dataset represented in every adult cluster, showing the abundance of each cell type found by clustering analysis.
C. Dot plot (confusion matrix) showing the proportion of gng8+ cells in the adult dataset (rows) that were classified to larval cluster labels (columns). Each adult habenular type was assigned to a larval cluster label if >15% of the trees in the RF model contributed to the majority vote. Proportion of cells in each row should add to a 100%.
D. Dot plot (confusion matrix) showing the proportion of larval cells (rows) that were classified to cluster labels of the gng8+ cells in the adult dataset (columns). Each adult habenular type was assigned to a larval cluster label if >15% of the trees in the RF model contributed to the majority vote. Proportion of cells in each column should add to a 100%. This training on the adult dataset was performed to validate the robustness of the RF analysis.
E. FISH validation and localization of select dorsal habenular cluster markers.
F. FISH validation of the genes that are expressed in all ventral clusters (aoc1) and across three other ventral sub-clusters (cd82a, mprip and zgc:173443).
