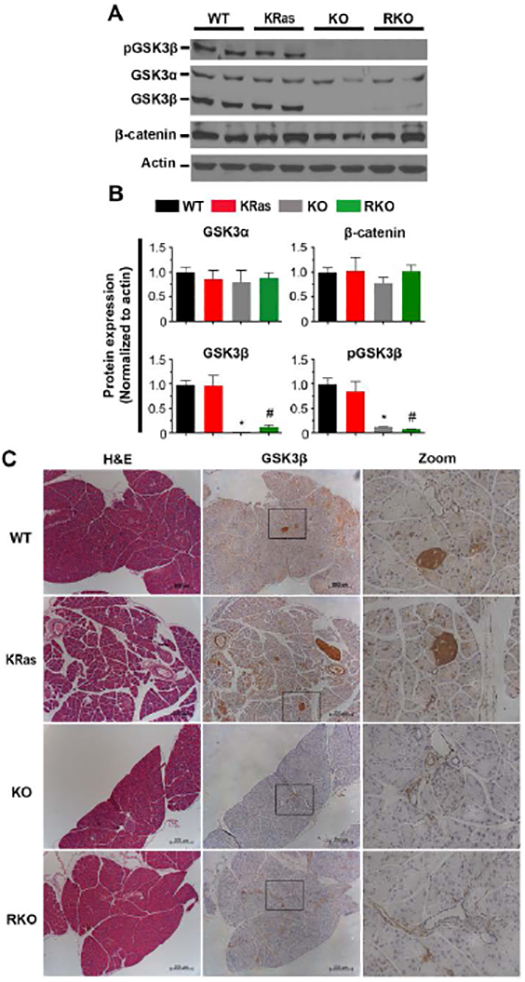
Figure 3. Deletion of GSK-3β in the pancreas of genetically engineered mice.

(A) Pdx1-cre, LSL-KRasG12D, GSK-3βF/F mice were used to generate mice of desired genotypes as described in the Materials and Methods. The expression of phospho-GSK-3β (Ser9), GSK-3α/β and β-catenin in pancreatic tissues was examined by immnoblot. β-actin was used as a loading control. Shown are representative results from 6 experiments. (B) The average signal intensity of phospho-GSK-3β (Ser9), GSK-3α/β, β-catenin were quantified and expressed as mean ± SEM. n=6. *P<0.05 KO versus WT mice. #P<0.05 RKO versus KRas mice. (C) H&E and IHC staining for detection of GSK-3β expression in pancreas sections of WT, KRas, KO, and RKO mice. Representative images were taken under low and high magnification lens. Bars, 200 μm.
