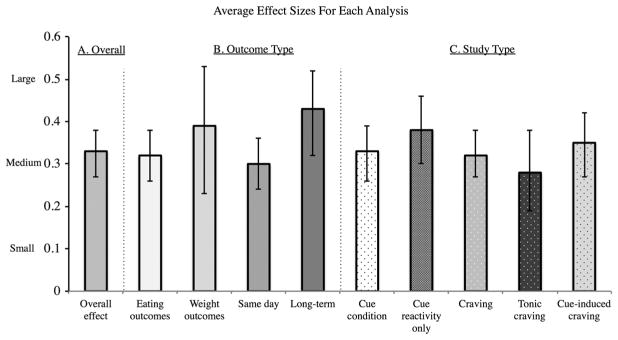
Figure 3.
Average effect sizes for Hypotheses 1–3. Average effect sizes and confidence interval: (A) overall, across all study types; (B) separately by outcome type; and (C) separately by study type. All effect sizes are medium or medium-to-large following Cohen’s d convention. ‘Cue condition’ includes all studies that measured responses to cue exposure, including cue-condition, cue reactivity (physiological and neural) and cue-induced craving. ‘Craving’ includes both tonic and cue-induced craving. The effect size in males represents NSTATISTICS = 1.

