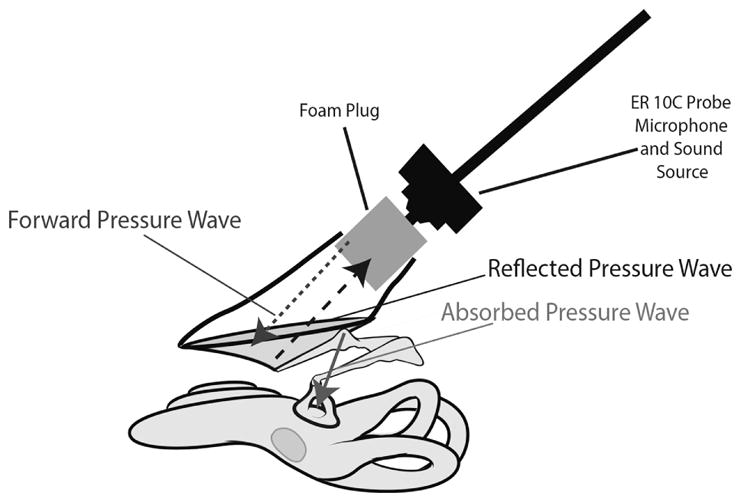
Fig. 2.

Illustration of reflectance measurement. A schematic of the set-up for reflectance measurements in temporal bone preparations, including the sound source, foam plug in the ear canal, tympanic membrane, ossicles and cochlea. The average distance between the medial surface of the foam plug and the tympanic membrane was 1 cm.
