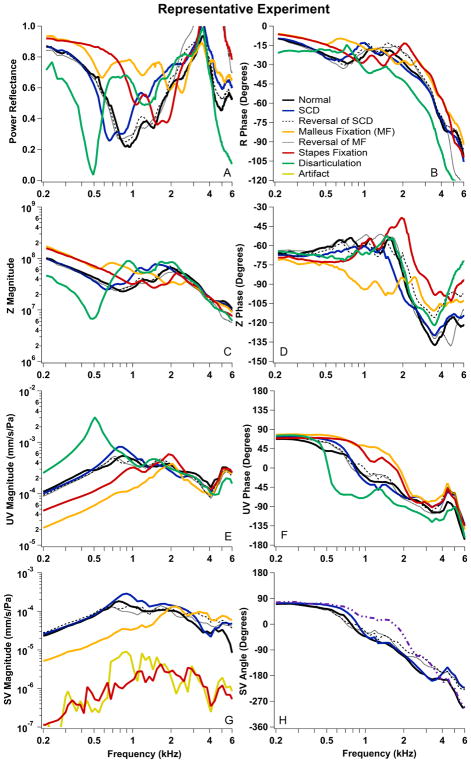
Fig. 4.
Data from one representative experiment in a single cadaveric preparation. (A) Power reflectance (PR); (B) Angle of the pressure reflectance (R); (C & D) Magnitude and angle of the measured impedance in the ear canal (ZEC); (E & F) Magnitude and angle of the umbo velocity normalized by ear-canal sound pressure (UV); (G&H) Magnitude and angle of the Stapes velocity normalized by ear-canal sound pressure (SV). Normal initial measurements are plotted with solid black lines and solid colored lines represent measurements after manipulations (SCD in blue, malleus fixation in orange, stapes fixation in red, and disarticulation in green). Measurements after the reversal of the SCD and malleus fixation manipulations are plotted with black dashed and dotted lines.

