. 2018 Jun 25;7:e36157. doi: 10.7554/eLife.36157

Figure 1. H3pT11 responds to nutritional stress.

(A) H3pT11 levels in the media containing different concentration of glucose measured by western blots. Wild type (BY4741) yeast cultures at early mid-log phase (OD 0.4) were shifted from YPD to YP media containing 0.02, 0.2, or 2% glucose for 1 hr at 30°C. (B) H3pT11 levels in the media containing non-fermentable glycerol measured by western blots. WT cultures were shifted from YPD to YP with 3% glycerol for indicated times. (C) The averaged profiles of H3pT11 at 366 genes, whose H3pT11 levels are increased in YPglycerol (Glycerol) compared to YPD (Glucose) condition. TSS: transcription start site; TES: transcription end site. (D) Normalized H3pT11 levels to H3 at HXK1 and DLD1 gene loci in YPD and YPglycerol conditions. (E) GO term analysis of the 366 genes shown in (C). GO terms with a p-value less than 0.05 were included, and with at least two genes from the significant gene list annotated. The bars are based on the frequency of the term in the significant gene list divided by the frequency of the term in the genome.

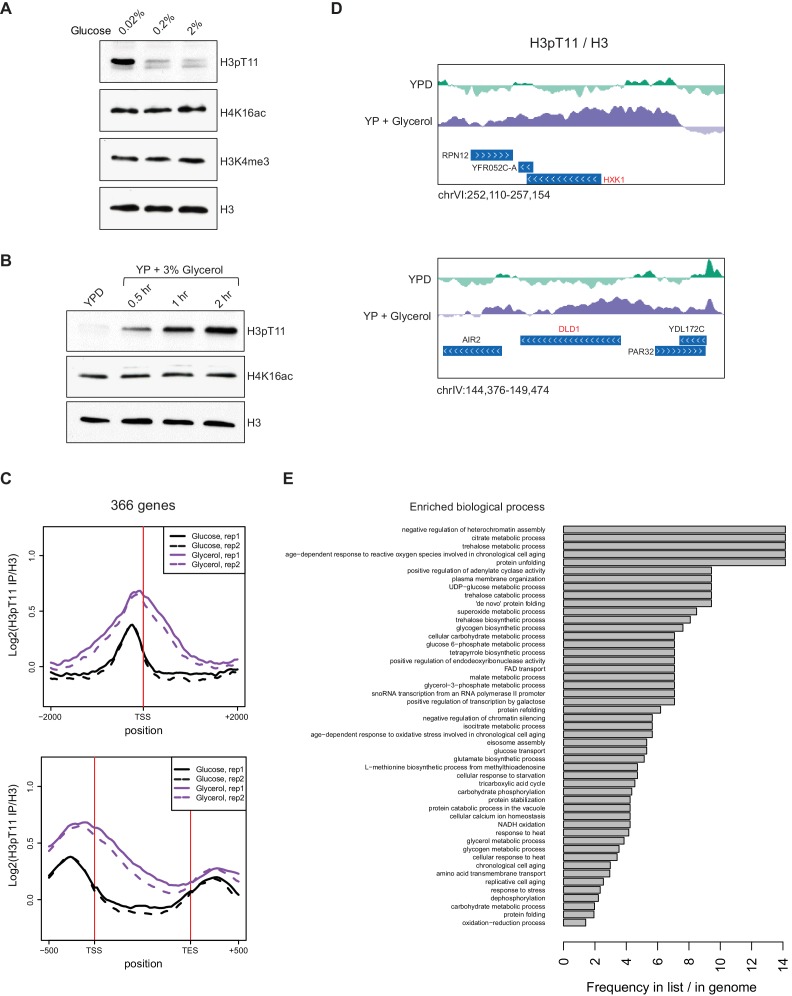
Figure 1—source data 1. H3pT11 occupancy of the genes shown in Figure 1C and Figure 1—figure supplement 2C.
DOI: 10.7554/eLife.36157.005

Figure 1.

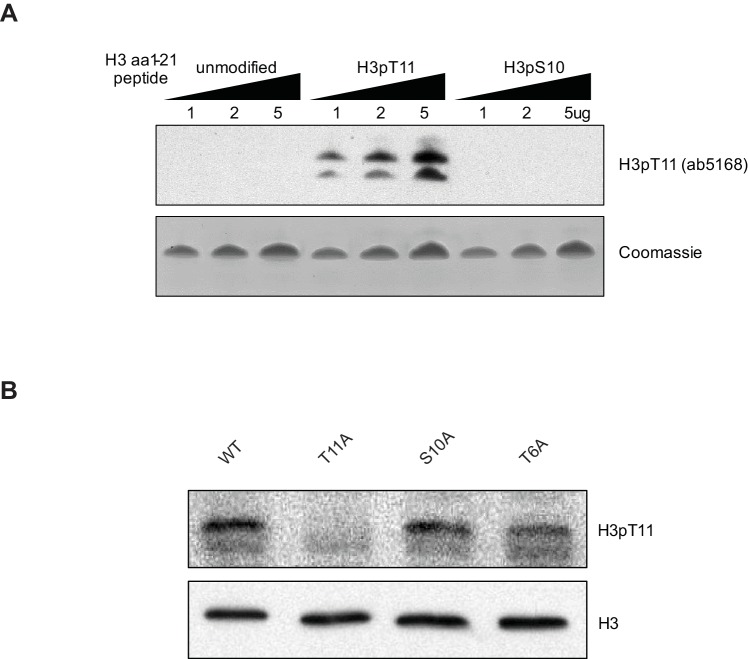
Figure 1—figure supplement 1. H3pT11 antibody validation.

Figure 1—figure supplement 1.

(A) H3pT11 antibody specificity test against unmodified, H3pT11, and H3pS10 containing histone H3 amino acids (aa) 1–21 peptides measured by Western blots. (B) H3pT11 levels in WT (ySE40), H3T6A, H3S10A and H3T11A strains in YPD.
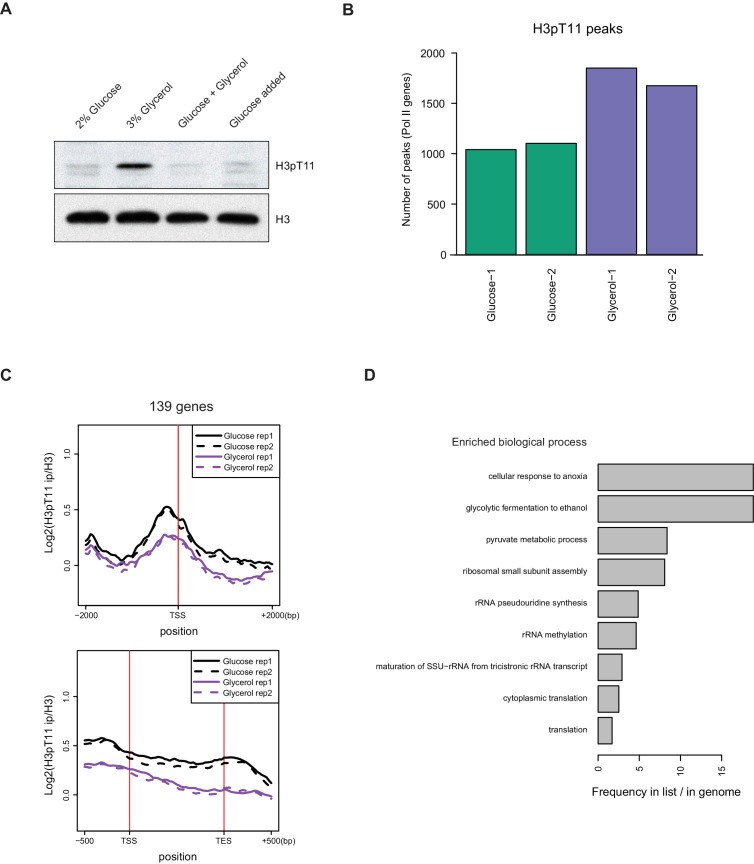
Figure 1—figure supplement 2. H3pT11 responds to low glucose condition.

Figure 1—figure supplement 2.

(A) Western blots showing H3pT11 levels in WT (BY4741) cultures shifted from YPD to YP media containing 2% glucose, 3% glycerol, or 2% glucose with 3% glycerol (Glucose + Glycerol) for 1 hr. For ‘Glucose added’ cells, WT cultures were initially shifted from YPD to YP with 3% glycerol for 1 hr, were then directly supplied with 2% glucose, and were further incubated for 1 hr. (B) A bar plot showing the total number of H3pT11 peaks in YPglycerol (Glycerol-1 and 2) and YPD (Glucose-1 and 2) ChIP-seq experiments. This bar plot does not include peaks overlapping non-pol II genes or peaks on the mitochondrial chromosome. (C) The average profiles of H3pT11 around the transcription start site (TSS) and across the gene body for 139 genes whose H3pT11 levels are decreased in YPglycerol (Glycerol) compared to YPD (Glucose). tRNA and rRNA genes have been excluded. TES: transcription end site. (D) GO term analysis of the 139 genes, of which H3pT11 levels are decreased, from ChIP-sequencing data shown in (C).