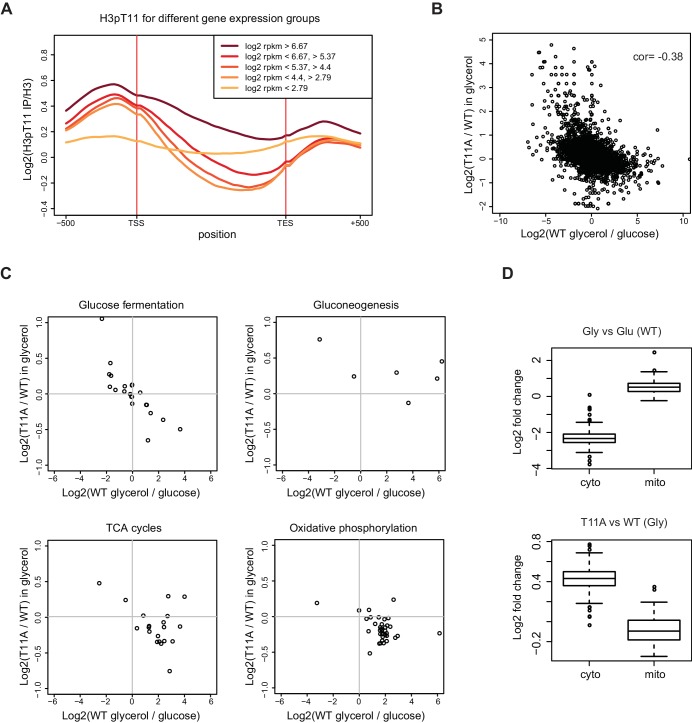
Figure 2. H3pT11 regulates transcription involved in metabolic transition upon nutritional stress.
(A) The average H3pT11 signal of genes from five different gene expression quantiles in YPglycerol. The groups are established by dividing the genes into equally sized quantiles based on the RPKM (Reads Per Kilobase Million) value in YPglycerol. Each group contains 1355 genes. (B) A scatter plot from RNA-seq data showing a negative correlation between transcription changes upon media shift from YPD to YPglycerol (x-axis), and the changes in H3T11A mutant compared to WT in YPglycerol condition (y-axis). (C) Scatter plots from RNA-seq for transcripts of genes in indicated pathways. (D) Box-plots showing expression changes of cytoplasmic (cyto) and mitochondrial (mito) ribosomal subunit genes upon nutritional stress condition (upper panel) and in H3T11A mutant in YPglycerol condition (lower panel). Gly: YPglycerol growth condition; Glu: YPD growth condition.


