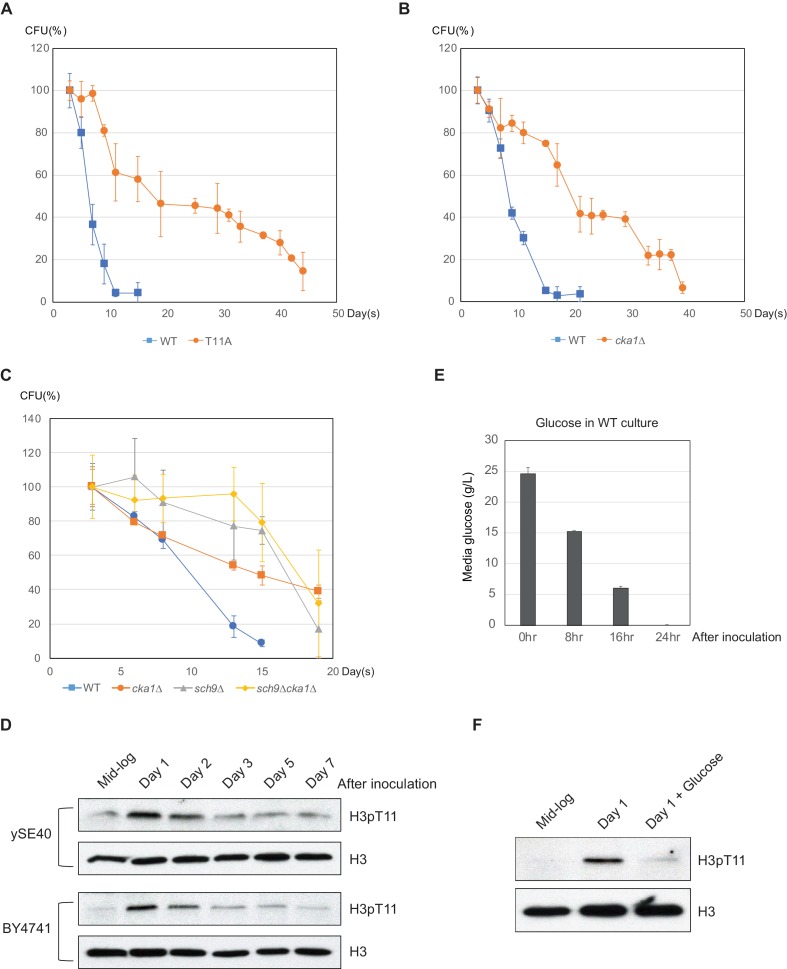
Figure 5. Phosphorylation of H3T11 regulates CLS.
(A) CLS assays of WT (ySE40) and H3T11A strains. (B) CLS assays of WT (BY4742) and cka1Δ strains. (C) CLS assays of WT (BY4742), cka1Δ, sch9Δ, and sch9Δcka1Δ strains. Error bars in CLS assays indicate STD from three biological replicates. CFU: colony- forming units. (D) H3pT11 levels measured at indicated times during CLS assay of ySE40 (WT of histone mutant strains) and BY4741 strain analyzed by western blots. (E) A Bar graph displaying media glucose concentration measured from the WT strain culture at indicated times in the CLS assay. Error bars indicate STD of three biological replicates. (F) H3pT11 levels of WT strain at exponential growth stage (mid-log), saturated day one culture (day 1), and day one culture with re-supplemented glucose (day 1 + glucose) analyzed by western blots. For day 1 + glucose culture, 2% glucose was directly added to saturated day one culture, then incubated for additional 1 hr.


