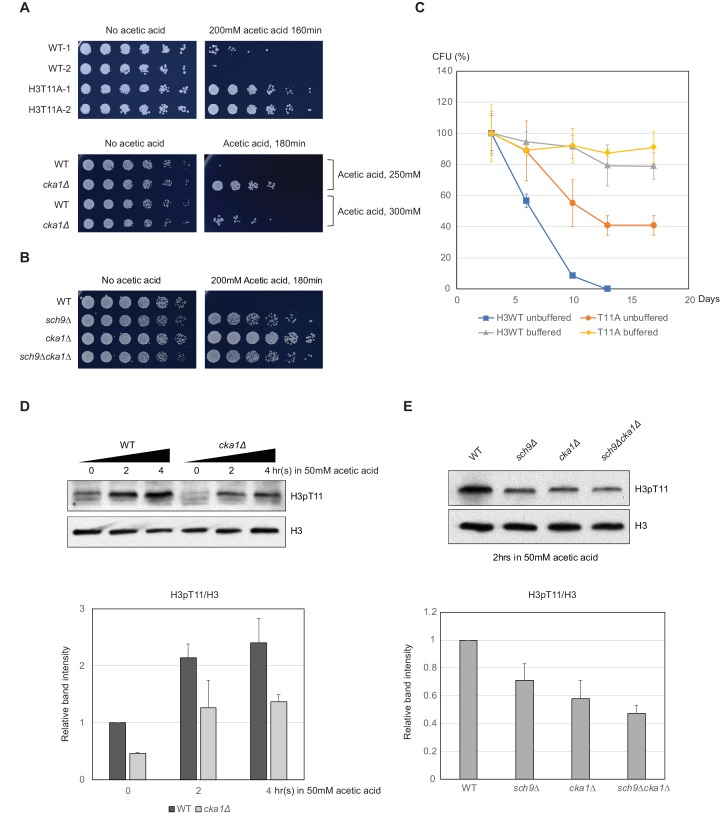
Figure 6. H3pT11 affects CLS by regulation of acetic acid resistance.
(A) Relative viability of H3T11A and cka1Δ mutants compared to their WT strains after exposure to indicated durations and concentrations of acetic acid. (B) Acetic acid resistance of WT, sch9Δ, cka1Δ, and sch9Δcka1Δ. (C) CLS assays of WT and H3T11A strains in buffered (pH 6.0) or unbuffered conditions. (D) H3pT11 levels in WT and cka1Δ upon 50 mM acetic acid addition analyzed by western blots (upper). The relative band intensities of H3pT11 to H3 signals (lower). (E) H3pT11 levels in WT, sch9Δ, cka1Δ, and sch9Δcka1Δ at 2 hr after 50 mM acetic acid treatment analyzed by western blots (upper). The relative ratios of H3pT11 to H3 signals (lower). All error bars indicate STD from three biological replicates.


