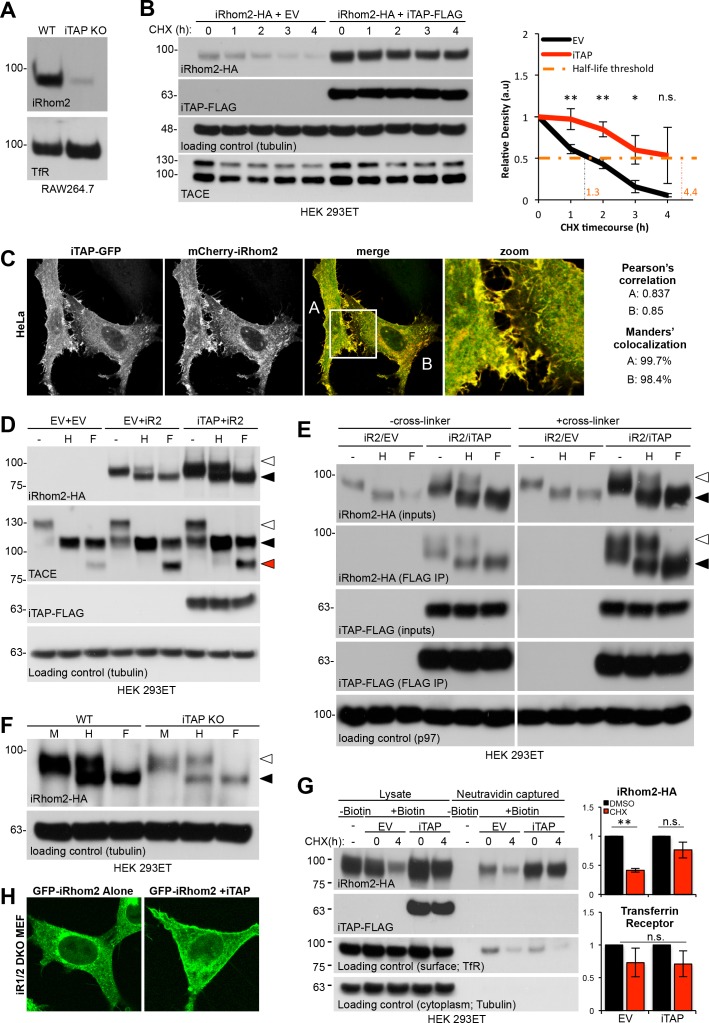
Figure 5. iTAP is required to promote iRhom stability at the cell surface.
(A). iRhom2 is depleted in iTAP KO cells. Lysates from WT vs iTAP KO RAW 264.7 were probed for endogenous iRhom2. The transferrin receptor (TfR) is a loading control. (B). iTAP expression enhances the stability of iRhom2. Stable iRhom2-HA-expressing HEK 293ET were transiently transfected with empty vector (EV) or iTAP-FLAG. 48 hr post-transfection, the cells were treated with 100 µg/mL Cycloheximide (CHX) for the indicated durations. The stability of iRhom2 was assessed by HA blotting. The graph to the right of the panel indicates the relative density of iRhom2-HA bands from cells expressing EV (black) versus iTAP (red). The half-life of iRhom2 under both conditions is calculated. (C). iTAP and iRhom2 co-localize. HeLa cells were transfected with iTAP-GFP and mCherry-iRhom2. Two areas, A and B, were selected for the calculation of the Pearson’s correlation and Manders’ colocalization co-efficients, respectively. (D). iTAP expression enhances the post-ER form of iRhom2. HEK 293ET expressing stably iRhom2-HA minus or plus stably expressed iTAP-FLAG were deglycosylated with Endo-H or PNGase F. (E). iRhom2-HA stably expressing HEK 293ET cells were transiently transfected with EV or iTAP-FLAG. Cells were treated ± the thiol-reducible cell-permeable crosslinker, DSP, and then anti-FLAG immunoprecipitations were performed from the lysates. Prior to SDS-PAGE and immunoblotting, lysates and co-immunoprecipitates were denatured in the presence of DTT to break the DSP-mediated covalent cross-links. Samples containing iRhom2-HA were deglycosylated as described before. (F). ER exit of iRhom2 is not impaired in iTAP KO cells. WT or iTAP KO HEK 293ET were transiently transfected with iRhom2-HA. Their lysates were deglycosylated as described. Endo-H–sensitive (black arrowhead) and –insensitive (white arrowhead) bands are noted. (G). iTAP expression stabilizes iRhom2 on the cell surface. The same cell lines as in (B), (E), were subject to a cell surface biotinylation protocol and the cell surface levels of iRhom2 in response to CHX treatment were evaluated. The graphs on the right hand side show densitometric analysis of the surface fractions of iRhom2-HA (upper graph) or TfR (lower graph) (H). iRhom1/2 DKO MEFs stably expressing mouse eGFP-iRhom2 either alone or together with mouse iTAP-mCherry were imaged as live cells. The eGFP-iRhom2 signal is shown.
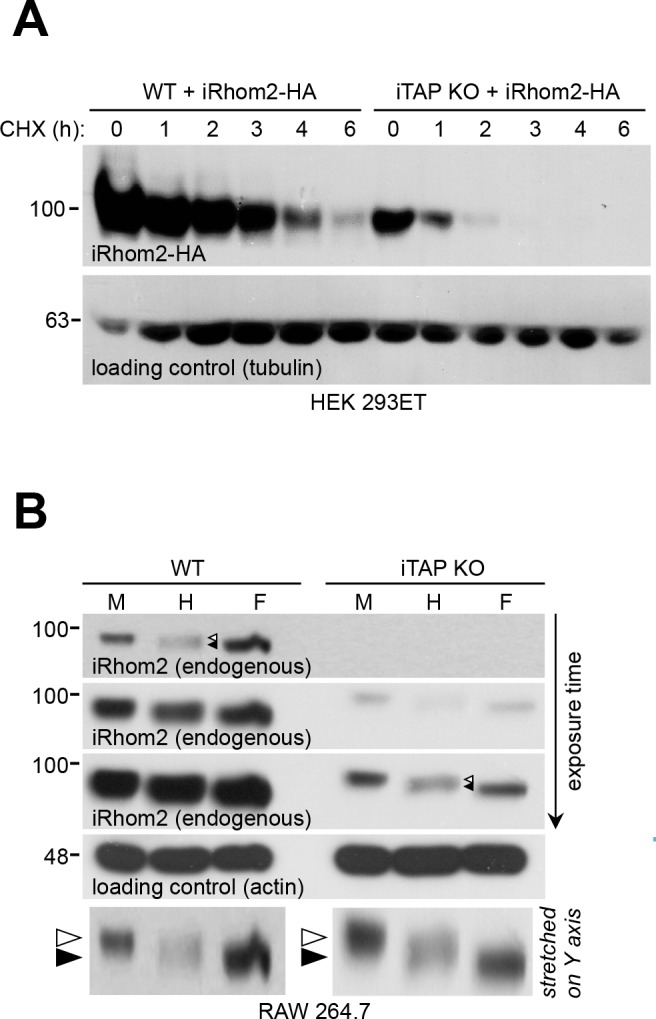
Figure 5—figure supplement 1. iTAP ablation increases iRhom2 degradation but doesn’t affect its ER exit.


