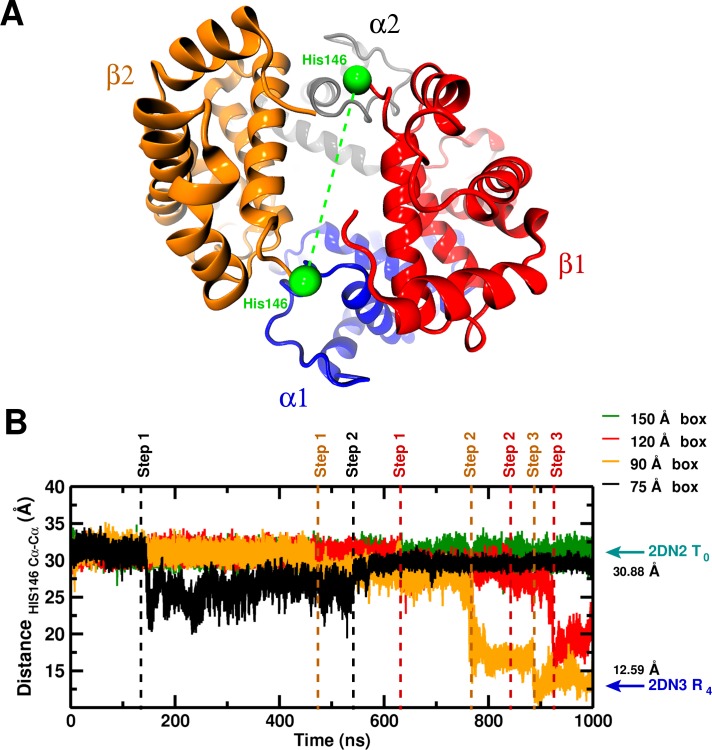
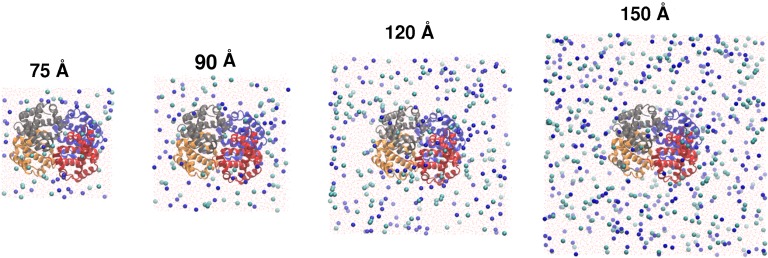
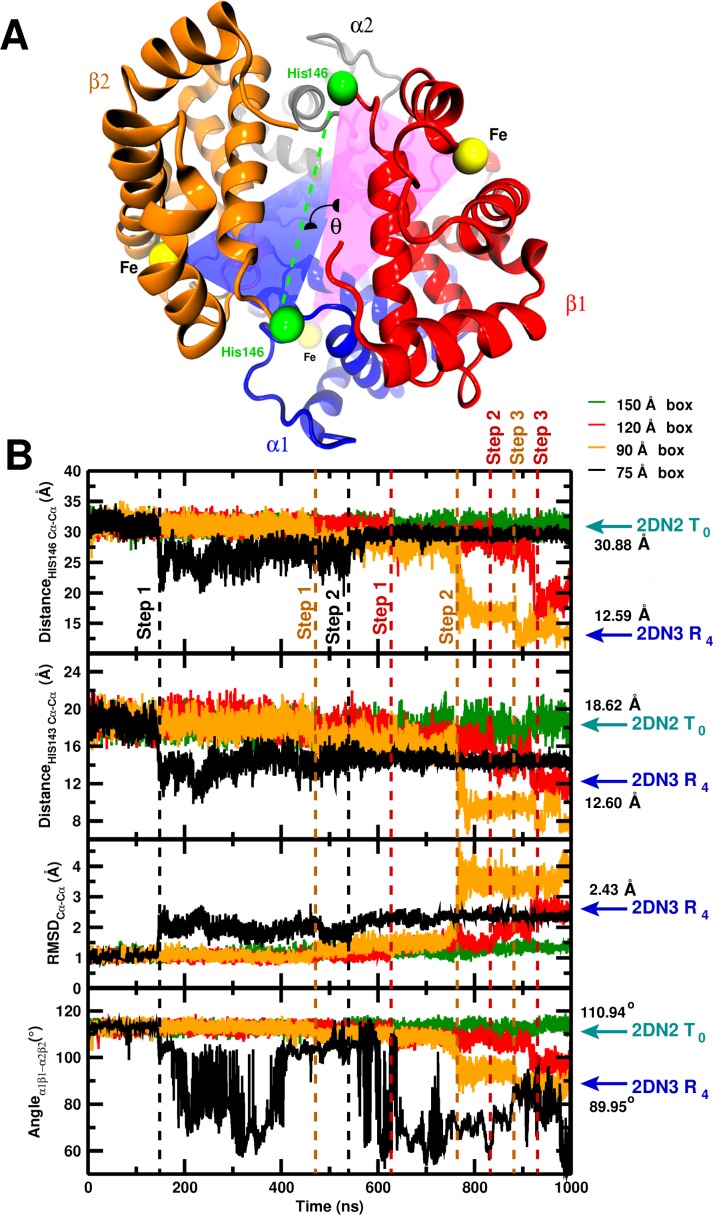
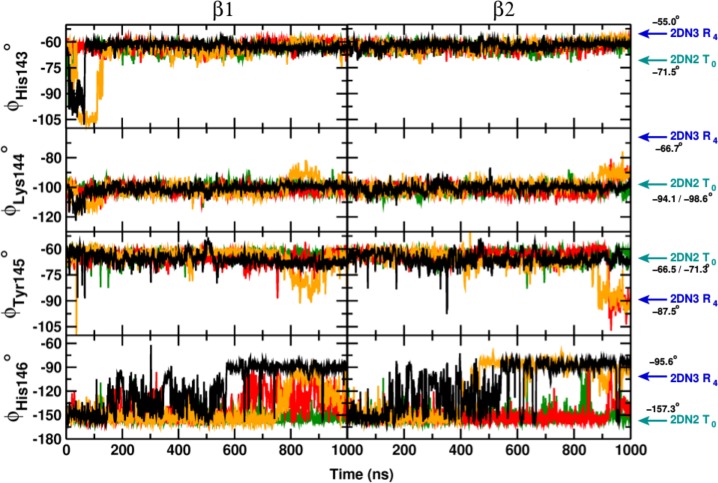
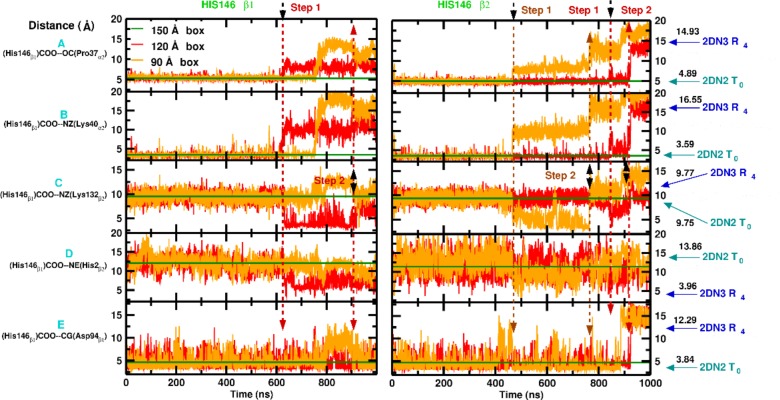
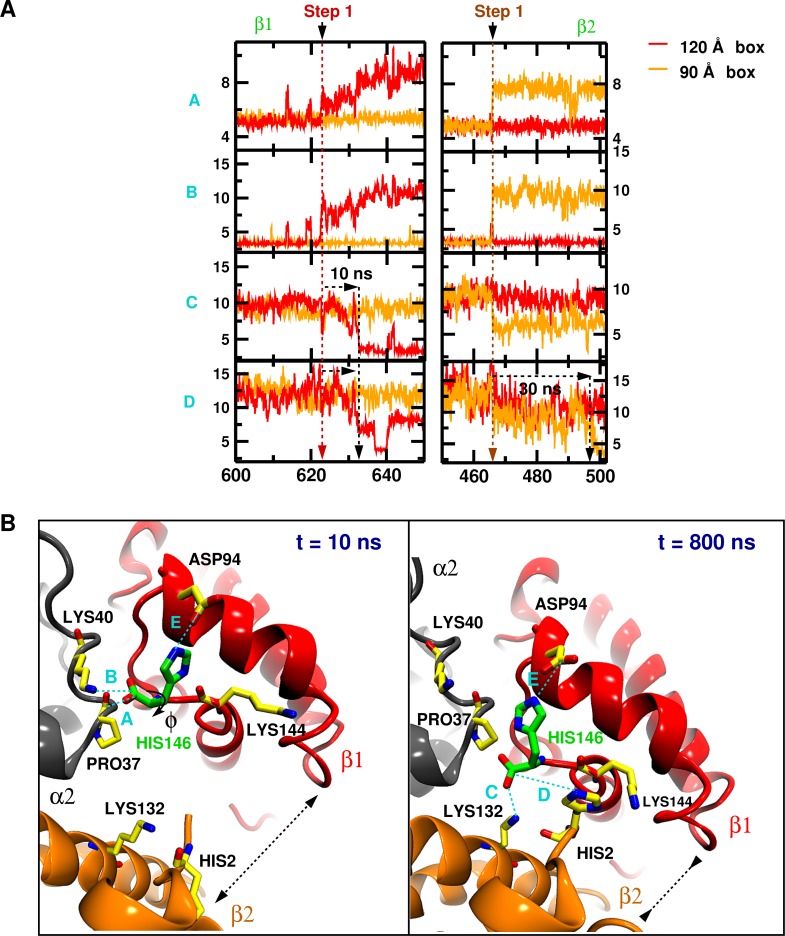
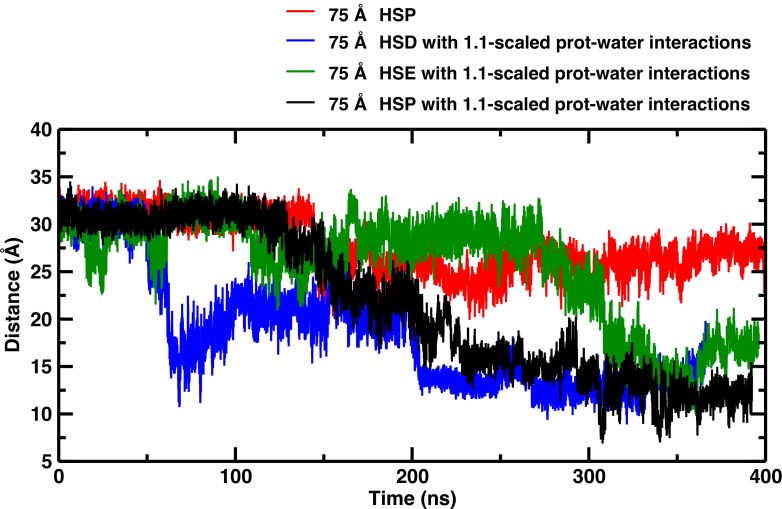
Figure 1. Global structural changes depending on box size.
Panel A: Overall structure of the hemoglobin tetramer. The His146 side chains (green spheres) are specifically indicated. Panel B: Temporal change of the C–C distance between His146 and His146. The dashed lines (black, orange, red) indicate transition points for the 75, 90, and 120 box, respectively. Cyan and blue arrows indicate the values of the corresponding observable found for the deoxy T (2DN2) and oxy R (2DN3) states, respectively.

