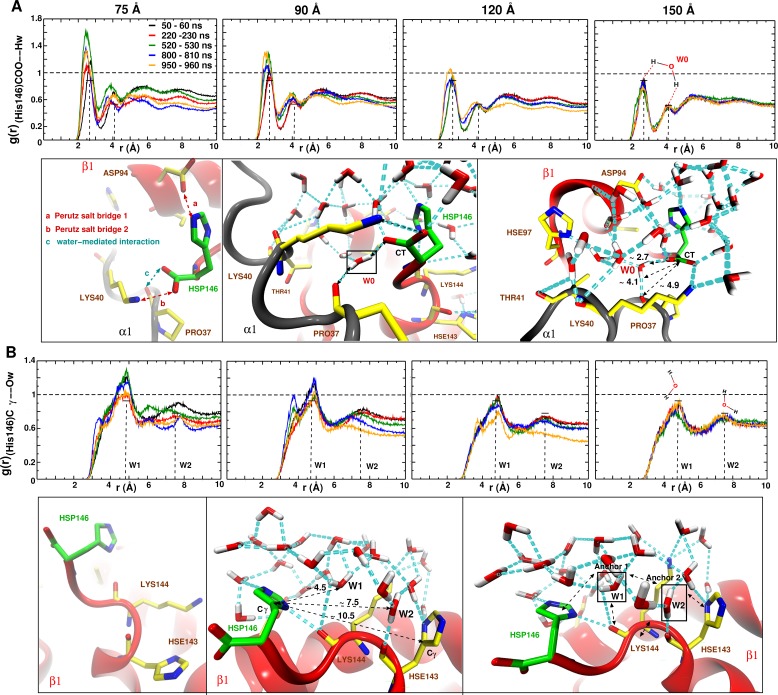
Figure 6. Averaged radial distribution functions between His146 and water for the different box sizes and for simulation windows before, during and after the structural transitions (see Figure 1).
Analysis for (A) the C-terminal (CT) of His146 and Water H (Hw) and (B) for C of His146 and water O (Ow). For the largest (150 Å) box no appreciable change in is found. The two peaks at 2.7 and 4.1 Å in (A) and the two peaks at 5 and 7.5 Å in (B) are due to a water network as indicated in the sketches. The sketches in A and B represent different views of the same snapshot taken from the MD simulation of the 150 Å box at ns and is used here as reference to describe the water network because this box represented a stable . Sketches in (A) emphasise the water network at the C-terminal of His146, and sketches in (B) emphasise the water network at the C of His146. Waters W0, W1 and W2 are key structural waters (used as anchor) in the stability of the T state (they are framed with a black line). This network is stable for simulations in the largest box but unstable in the other boxes. His143 is singly protonated () and His146 is doubly protonated (N and N).

