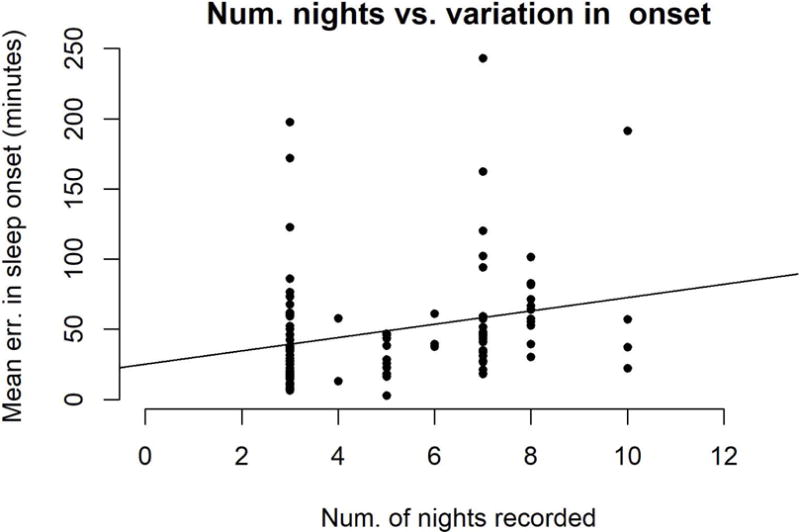
Figure 1.

Variation in sleep onset is shown as a function of the number of nights of sleep recorded for each participant (best fit line y = 25.2 + 4.7*x). The profile of sleep recording lengths is bi-modally distributed around 3 nights and 7 nights, which is insufficient to test for a non-linear relationship. However, since a significant linear relationship was found, we include “number of nights recorded” as a control variable.
