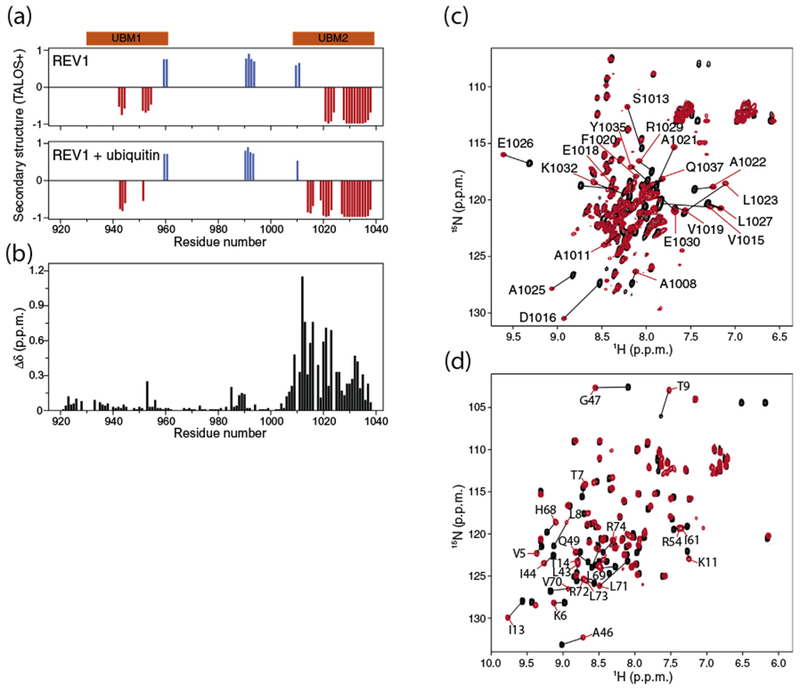
Fig. 1.

Interaction of human REV1 (932–1039) with ubiquitin. (a) Prediction of α-helical (red) and β-sheet (blue) regions in apo REV1 (top) and in REV1 titrated with threefold molar excess ubiquitin (bottom) based on TALOS+ analysis of Cα, Cβ, C′, HN and N NMR chemical shifts [43]. The UBM1 and UBM2 regions are shown in orange. (b) Chemical shift perturbations in the 1H–15N HSQC spectrum of 15N-labeled REV1 (1 mM concentration) caused by addition of threefold molar excess of unlabeled ubiquitin. The normalized chemical shift changes Δδ in parts per million (ppm) for the 1H–15N correlation signals are defined as . (c) Overlay of the 1H–15N HSQC spectra of 15N-labeled REV1 at 0.5 mM concentration before and after addition of threefold molar excess of unlabeled ubiquitin. (d) Overlay of the 1H–15N HSQC spectra of 15N-labeled ubiquitin at 0.3 mM concentration before and after addition of 5-fold molar excess of unlabeled REV1.
