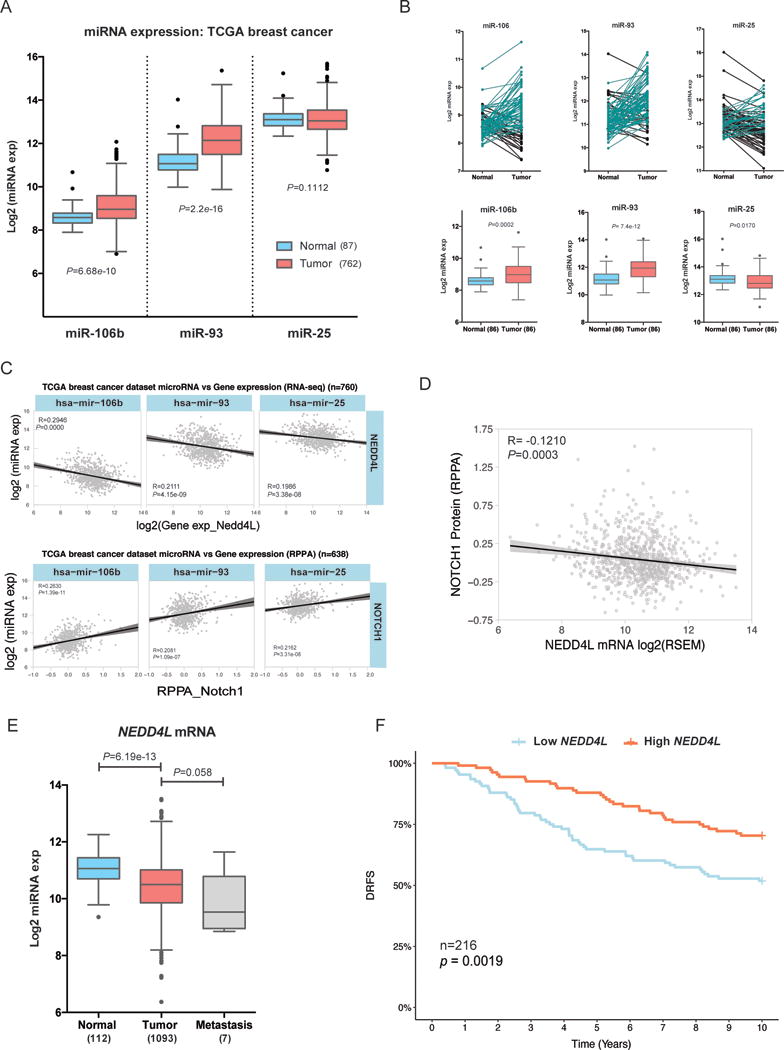
Figure 6. The miR-106b-25/NOTCH1/NEDD4L axis is relevant in human breast tumors.

(A–C) In the TCGA breast invasive carcinoma dataset we plotted (A) the normalized log2 miRNA expression for each microRNA in normal adjacent breast tissue (n=87) vs. breast tumor tissue (n=762), statistics derived from KS test. (B) Top: The normalized log2 expression of each miRNA in matched normal and tumor samples are plotted, with black lines corresponding to samples where expression is decreased in matched tumor tissue and aqua lines corresponding to samples where expression is increased in matched tumor tissue. Bottom: Box and whisker plots of the above data with statistics derived from KS test C) Pearson correlations between individual miRNAs within the cluster (log2 normalized) and NEDD4L mRNA expression extracted from TCGA RNAseqV2 (Log2 normalized) (top), and Pearson correlations between miRNA expression (miRNA-seq) and NOTCH1 protein expression (from TCGA RPPA) (bottom). (D) Pearson correlation demonstrates a negative association between NEDD4L mRNA expression and NOTCH1 RPPA protein expression in the TCGA breast cancer dataset (E) Differential expression of NEDD4L mRNA (RSEM value) in normal vs. breast tumor vs. metastatic tissue in same TCGA dataset as A–C (F) Kaplan-Meier of Distant Relapse Free Survival (DRFS) in 216 individuals with early primary breast cancer, compiled from GEO dataset (GSE22219), stratified into NEDD4L high (above the median) vs. low (below the median).
