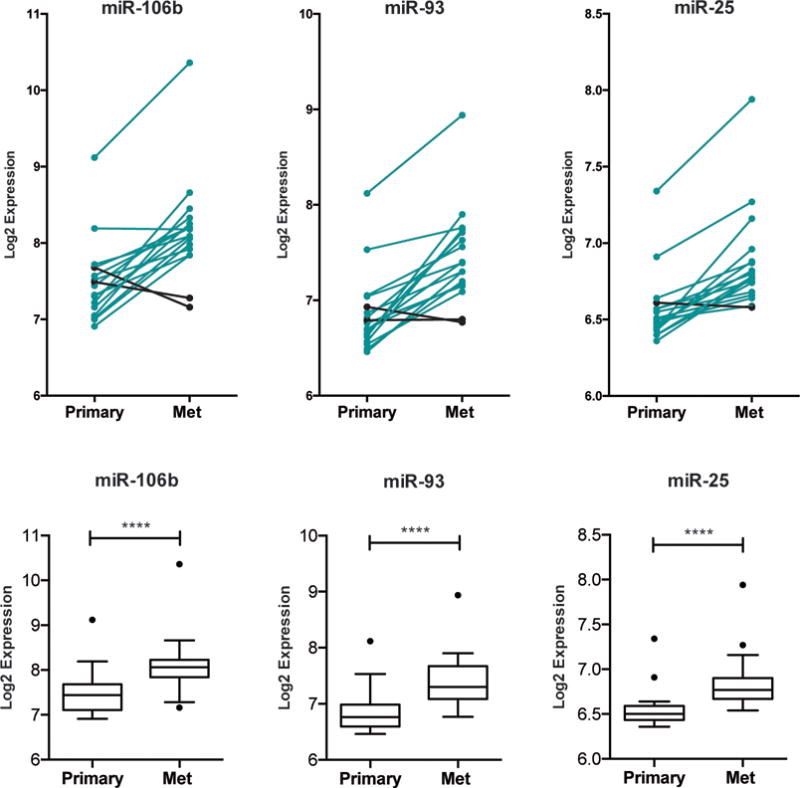
Figure 7. The miR-106b-25 cluster is increased in human breast cancer metastasis.

Data was extracted from GSE37407, which contains miRNA expression profiling on primary breast tumors vs. matching metastatic tissue, and was then interrogated for expression of each miRNA in the miR-106b-25 cluster. Top: The normalized log2 expression of each miRNA in matched tumor and metastatic (mets) sample is plotted, with black lines corresponding to samples where expression is decreased in matched mets and aqua lines corresponding to samples where expression is increased in matched mets. Bottom: Box and whisker plots of the above data with statistics represented as KS test.
