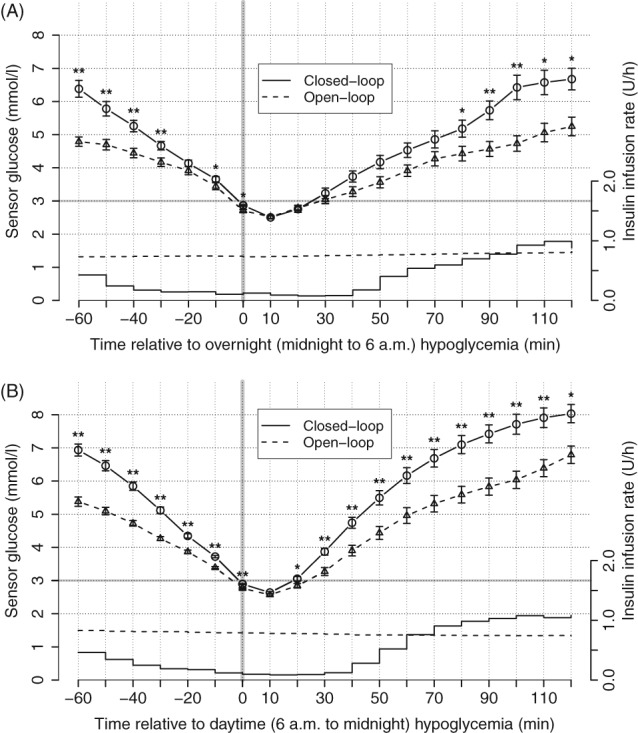
Figure 2.

Sensor glucose values from −60 to 120 minutes relative to the onset of hypoglycaemia (sensor glucose <3.0 mmol/L; vertical bar) during the hybrid closed‐loop period (circles connected by solid line; mean ± SEM; N = 60; * P < .05, ** P < .01 compared to control therapy) and during the control period (triangles connected by dashed line). Piecewise‐constant lines without error bars represent mean insulin infusion rates during the closed‐loop period and dashed lines without error bars represent insulin infusions during the control period. Panel A, shows glycaemic and insulin infusion data during the night period (midnight to 6:00 am) and panel B, shows the day period (6:00 am to midnight)
