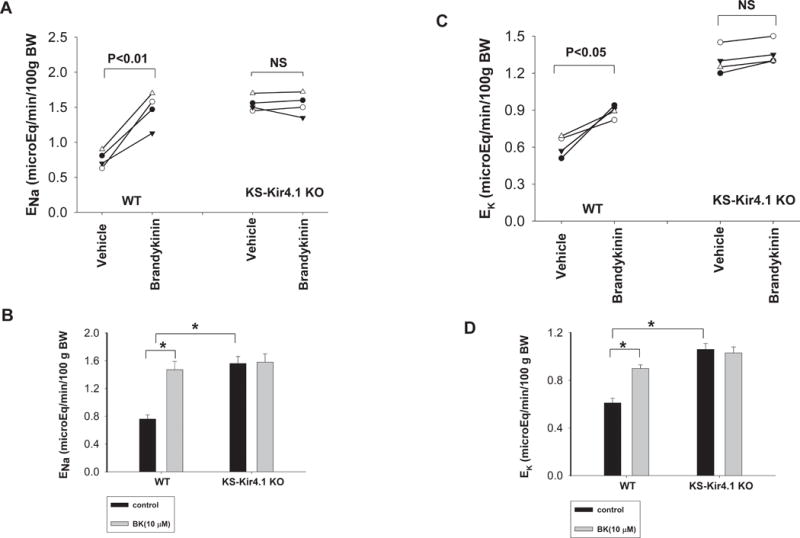
Fig. 5. BK infusion stimulates renal Na+ and K+ excretion.

(A) A line graph shows the results of each experiment in which urinary Na+ excretion (ENa) was measured before and after BK infusion in WT mice and KS-Kir4.1 KO mice. (B) The mean value and statistical information are shown in a bar graph. The basal level of ENa of KS-Kir4.1 KO mice is significantly different in comparison to WT mice. (C) A line graph shows the results of each experiment in which urinary K+ excretion (EK) was measured before and after BK infusion in WT mice and KS-Kir4.1 KO mice. (D) The mean value of EK and statistical information are shown in a bar graph. The basal level of EK of KS-Kir4.1 KO mice is significantly different in comparison to WT mice.
