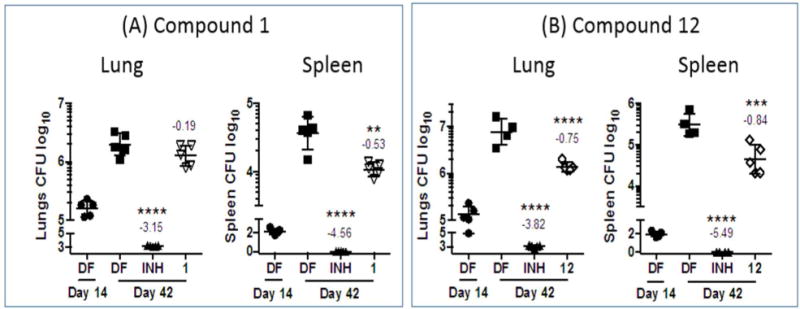
Figure 8.

In vivo efficacy of (A) 1 and (B) 12 in a mouse model of acute TB. Mice were dosed with either drug at 100 mg/kg (po) for 6 days per week, × 4 weeks. A similar dosing schedule applied to isoniazid (INH) at 25 mg/kg. CFU analysis of lung and spleen tissues were carried out on treated mice and drug-free (DF) infected mice at Day 14 (start of treatment, Early Control) and Day 42 (end of treatment, Late Control). Statistical analysis was by One-way ANOVA, multi comparison, Bonferroni post test, n=4/5 (4/5 mice per group); **p<0.01; ****p<0.0001. Figure depicts individual data points, means and SD. Numbers above groups reflect difference as compared to the drug free (DF) control at day 42 (Late Control).
