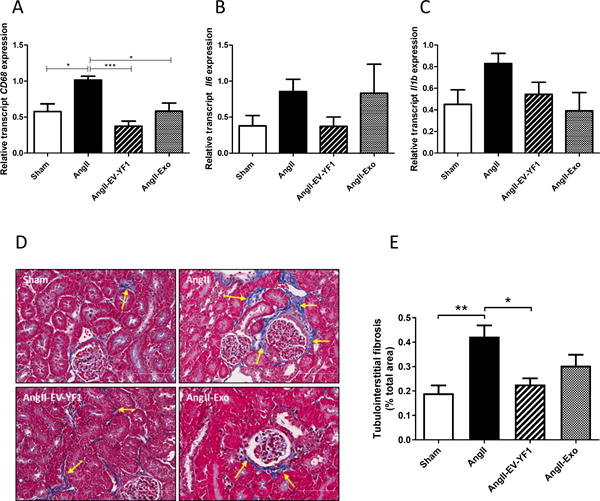
Figure 5. EV-YF1 and CDC-exo treatment decrease Ang II-induced kidney inflammation and fibrosis.

A-C, gene expression of CD68 in A, Il16 in B and Il1b in C in kidney tissue from mice that received subcutaneous infusion of Ang II for 28 days of saline or Ang II treated with saline, EV-YF1 or CDC-exo, as determined by qPCR. Graphs depict the mean ± SEM; n = 5 animals/group. D, micrographs (magnification: ×20) showing representative tubulointerstitial fibrosis (arrows) in kidney sections stained with Masson’s trichrome. E, Quantitative measurements of tubulointerstitial fibrosis within kidney sections. Data are means ± SEM; n = 5 animals/group. Scale bars = 70 μm. Groups were compared using 1-way ANOVA followed by Tukey’s multiple comparisons test; *P < 0.05, **P < 0.01, ***P < 0.001.
