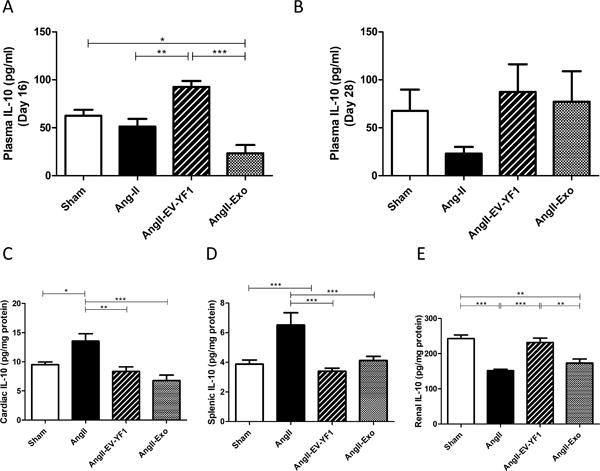
Figure 6. EV-YF1 and CDC-exo modulate IL-10 expression.

A, Plasma levels of IL-10 at day 16 of the study (ie: 24 h after the second injection of saline, EV-YF1 or CDC-exo in mice infused with Ang II), as determined by ELISA. Graph depicts the mean ± SEM; n = 4-5 animals/group. B-E, Plasma in B, cardiac in C, splenic in D and renal in E levels of IL-10 at the final day (day 28) of the study in mice that received subcutaneous infusion of saline or Ang II for 28 days treated with saline, EV-YF1 or CDC-exo, as determined by ELISA. Graphs depict the mean ± SEM; n = 5-9 animals/group. Groups were compared using 1-way ANOVA followed by Tukey’s multiple comparisons test; *P < 0.05, **P < 0.01, ***P < 0.001.
