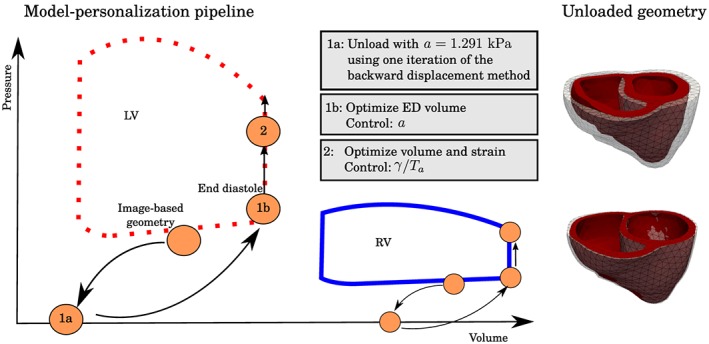
Figure 2.

To the left, we see the model‐personalization pipeline. The image‐based geometry corresponds to some image frame taken at mid‐diastole. An estimate of the unloaded geometry was found by applying 1 iteration of the backward displacement method using a=1.291 kPa according to Asner et al,21 followed by an estimation of a by minimizing the fit of the end‐diastolic volumes (EDV). During systole, both cavity volumes and circumferential strain were used in the optimization to determine the amount of active contraction in terms of the active control, which are, respectively, γ and T a in the active strain and active stress formulation. To the right, we show a comparison of the unloaded geometry for CASE 3. The upper figure shows the resulting unloaded, zero pressure geometry in red and the the original image‐based geometry in transparent, while the bottom figure shows the unloaded geometry, inflated to the target pressure in the image‐based geometry, and the original image‐based geometry in transparent for comparison
