
Figure 4.
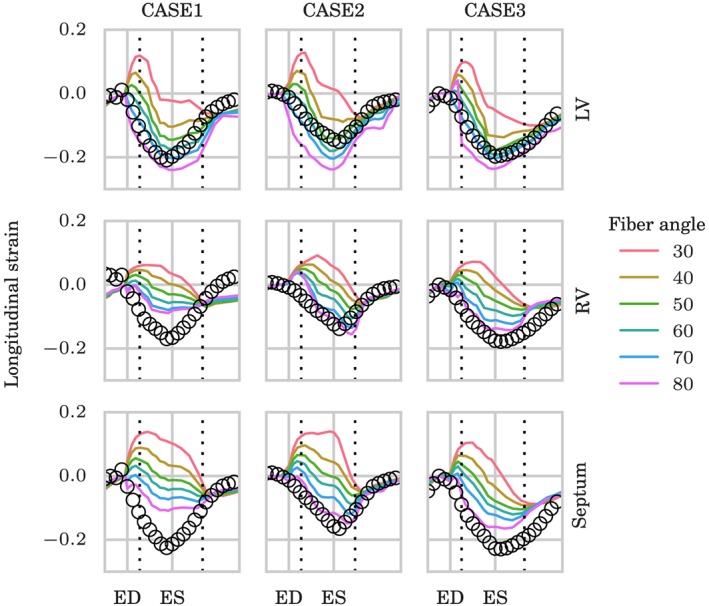
Validation of the model‐personalization process using simulated and measured longitudinal strain that was not used in the optimization. Upper, middle, and lower panel show the longitudinal strain curves for different choice of fiber angles in the left ventricle (LV), right ventricle (RV), and septum, respectively. ED, end‐diastole; ES, end‐systole