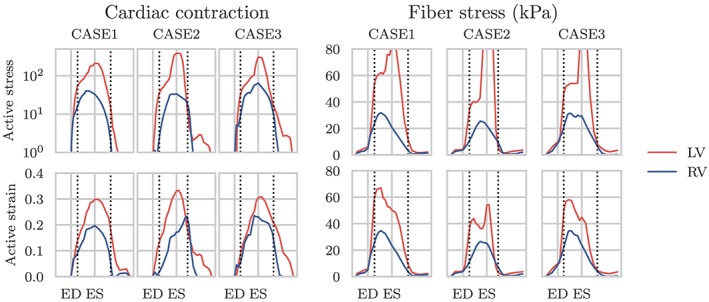
Figure 6.

Comparison of fiber stress and cardiac contraction using the active strain and active stress approach using 60° fiber angle. To the left, average traces of the active stress (top) parameter T a in (8), and the active strain (bottom) parameter in 3. The active stress parameter, with unit kPa, is plotted on a logarithmic scale for easier comparison with the active strain parameter. To the right, estimated Cauchy fiber stress using the active stress (top) and active strain formulation (bottom). On the x−axis, we plot the normalized time with respect to end‐diastole (ED) and end‐systole (ES). Horizontal dotted lines indicate timings of opening and closing of the aortic valve. LV, left ventricle; RV, right ventricle
