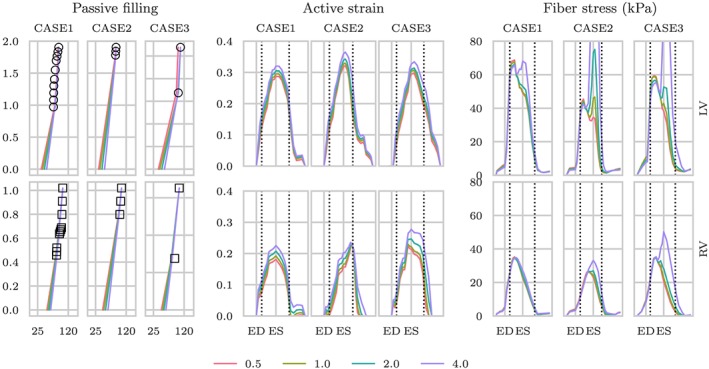
Figure A1.

To the left, we show the passive‐filling curves with volume in mL on the x−axis and pressure in kPa on the y−axis with different unloaded volume resulting from different material parameters used to estimate the unloaded geometries. Middle and right panels show average time traces of estimated active strain and Cauchy fiber stress, respectively, for different choices of unloaded configuration. Top row shows the results in the left ventricle (LV) while bottom row shows the results in the right ventricle (RV). Here ,the values a=0.5, 1.0, 2.0 and 4.0 kPa are used to unload the ventricles . ED, end‐diastole; ES, end‐systole
