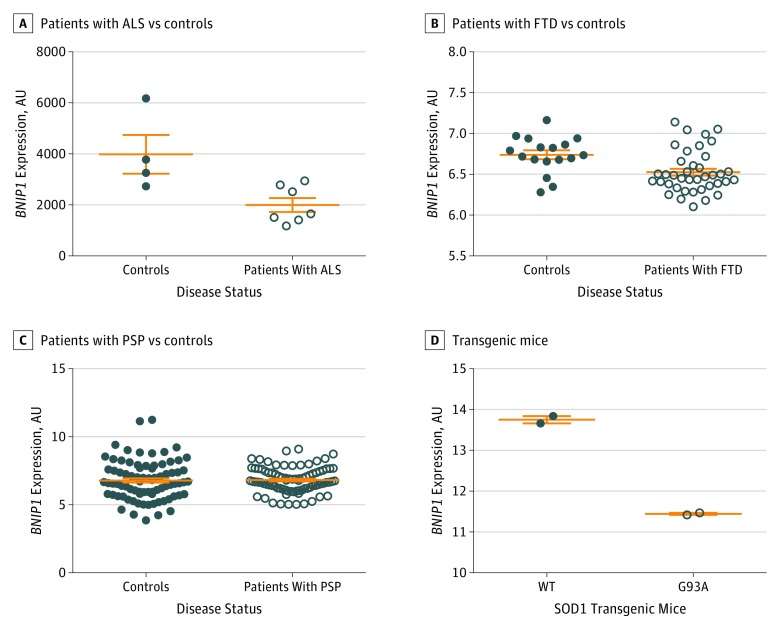
Figure 2. Reduced BNIP1 Expression in Neurodegenerative Tissue.
A, Differential expression in motor neurons isolated from patients with amyotrophic lateral sclerosis (ALS) (GSE833 [Gene Expression Omnibus accession number]; mean [SEM] value, 3984 [760.8] arbitrary units [AU] for 4 controls and 1999 [274.1] AU for 7 patients with ALS; P = .02). B, Differential expression in homogenates from brains of patients with frontotemporal dementia (FTD) (GSE13162; mean [SEM] value, 6.7 [0.05] AU for 11 controls and 6.5 [0.04] AU for 17 patients with FTD; P = .005). C, Differential expression in homogenates from brains of patients with progressive supranuclear palsy (PSP) (syn6090802; mean [SEM] value, 6.8 [0.2] AU for 80 controls and 6.8 [0.1] AU for 84 patients with PSP; P = .009). D, Differential expression in homogenates from spinal cords of SOD1 WT and SOD1 G93A transgenic mice (GSE4390; mean [SEM] value, 13.8 [0.09] AU for 2 SOD1 WT mice and 11.5 [0.025] AU for 2 SOD1 G93A mice; P = .002).

