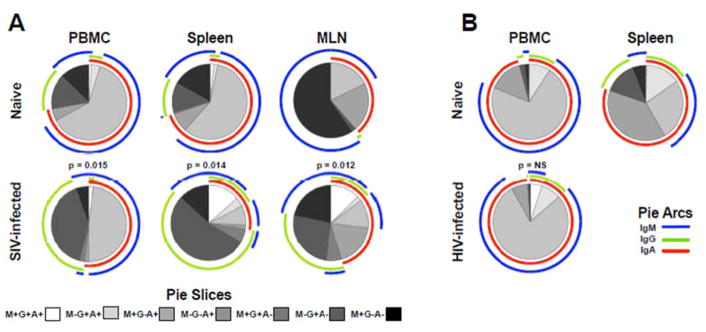
Fig. 5. Immunoglobulin expression on NKB cells in rhesus macaques and humans.
Distribution frequencies of IgA, IgG, and IgM calculated using Boolean gates of Ig positive samples averaged over 4 to 18 animals/human subjects per group, depending on tissue, using SPICE (v.5.3). Shaded pie slices indicate individual populations and pie arcs show overlapping expression of Ig molecules. Statistical evaluations were made between normal and infected samples and p values as determined by Permutations test are shown. NS, not significant.

