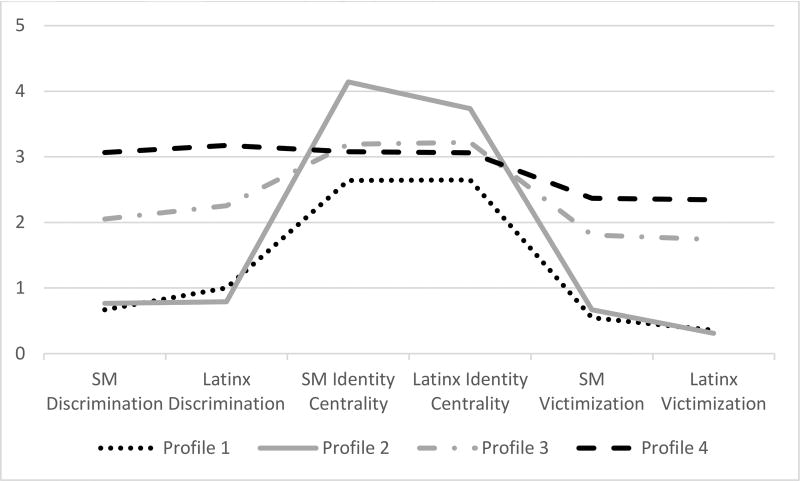
Figure 1. Four-profile solution for profiles of discrimination, victimization, and identity centrality.
Notes. SM = sexual minority.
The results presented are for the covariate-adjusted model, including networks of support (parental and friend) and acculturation. Range, mean (standard deviation) for each indicator: SM discrimination, 0–4, M = 1.63, SD = 1.01; Latinx discrimination, 0–4, M= 1.79, SD = 1.03; SM identity centrality, 1–5, M = 3.27, SD = 0.67; Latinx identity centrality, 1–5, M = 3.19, SD = 0.65; SM Victimization, 0–4, M = 1.40, SD = 0.79; Latinx victimization, 0–4, M = 1.25, SD = 0.88.
Percentages of participants classified into each profile: Profile 1, 22.4%, Profile 2, 40.6%, Profile 3, 14.6%, Profile 4, 22.4%.

