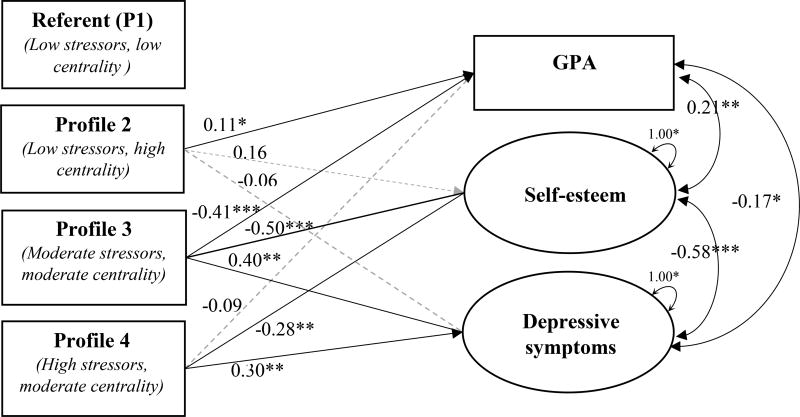
Figure 2. Path diagram of profile membership on GPA, self-esteem, and depressive symptoms.
Note. Standardized parameter estimates are reported.
Covariates included age, SES, language of survey, gender, gender nonconformity, and rurality. Black solid lines indicate estimates at p≤0.05; grey dashed lines indicate p>0.05. Further, statistical significance is indicated by: *p≤0.05 **p≤0.01 ***p≤0.001

