Fig. 1.
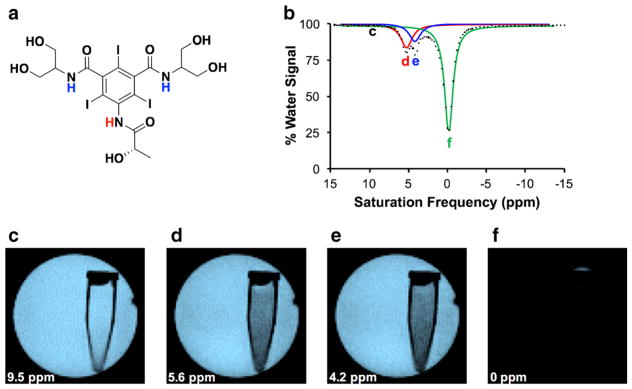
The acidoCEST MRI method. a Iopamidol has one amide proton that resonates at 5.6 ppm (red) and two magnetically equivalent amide protons that resonate at 4.2 ppm (blue), relative to the water resonance defined as 0 ppm. b A CEST spectrum of 20 mM of iopamidol in water shows a decrease in % water signal when saturation is applied at 5.6 or 4.2 ppm, as well as the direct saturation of water when saturation is applied at 0 ppm. The labels c–f show saturation frequencies used to produce panels c–f. c–f MR images of water signal in a tube of 20 mM iopamidol in a larger tube of water, with saturation applied at 9.5, 5.6, 4.2, and 0 ppm.

