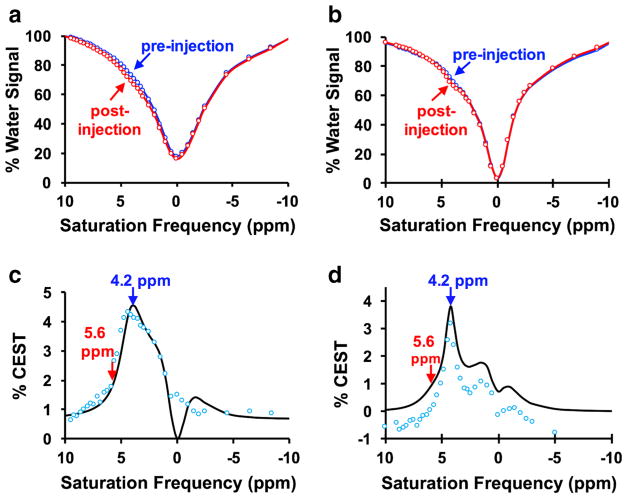
Fig. 3.
In vivo CEST spectra. The post-injection spectrum shows lower % water signal than the pre-injection spectrum at 4.2 and 5.6 ppm, for a a tumor with pHe 7.0, and b a tumor with pHe 6.8. c The difference between pre-injection and post-injection CEST spectra (blue circles) were fit with the Bloch-McConnell equations modified for chemical exchange (black line) for a tumor with pHe 7.0, and d a tumor with pHe 6.8.

