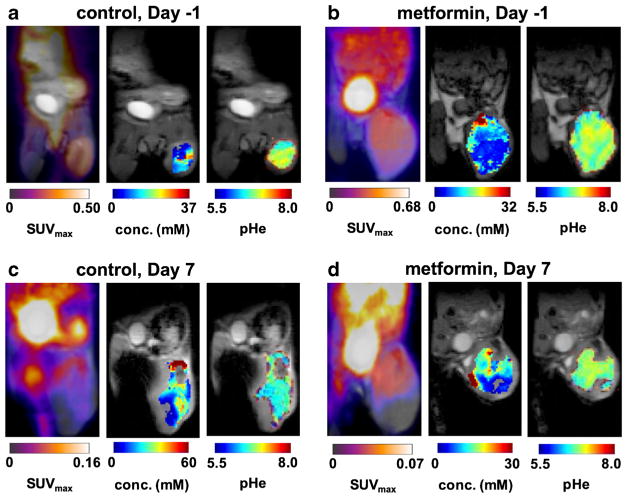
Fig. 4.
PET/MR images. a Images are shown for MIA PaCA-2 tumor model 1 day before treatment with metformin, b 1 day before treatment with vehicle control, c 7 days after treatment with metformin, and d 7 days after treatment with vehicle control. SUVmax maps of [18F]FDG show high signal in the flank tumor in the right leg. Very high signal was detected in the bladder. Parametric maps of iopamidol concentration and pHe in the tumor are overlaid on an anatomical MR image.

