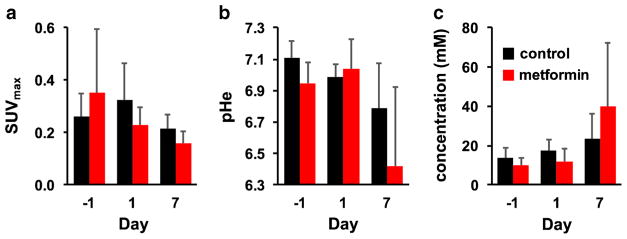
Fig. 5.
The effect of metformin on imaging biomarkers. a SUVmax measured with [18F]FDG PET showed a significant decrease (p ≤ 0.05) in the metformin-treated group and in the control group with longitudinal imaging. SUVmax was not significantly different (p > 0.05) between the metformin-treated and control groups on day 7. b pHe also significantly decreased in the metformin-treated group, but the decrease in pHe in the control group was not significant. pHe was not significantly different between the metformin-treated and control groups on day 7. c The concentration of iopamidol in the tumor significantly increased in the metformin-treated group, but did not significantly increase in the control group. Iopamidol concentrations were not significantly different between the metformin-treated and control groups on day 7.

