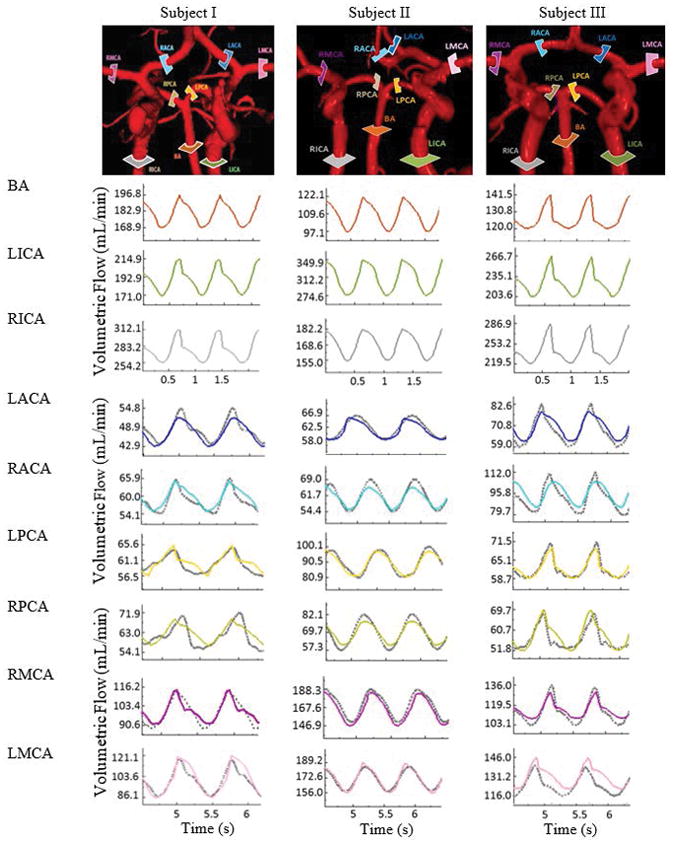
FIGURE 2.

Comparison of regional blood flow measurement and subject-specific simulation using PC-MRA flow measurements. Three examples of in vivo measurements are shown in the first row. The color-coded slice plane is perpendicular to the longitudinal axis of a vessel segment showing where the measurement was made in the main cerebral arteries. The solid color-coded curves are measured blood flow and gray dotted profiles are the simulated blood flow in the main arteries of the cerebral arterial tree.
