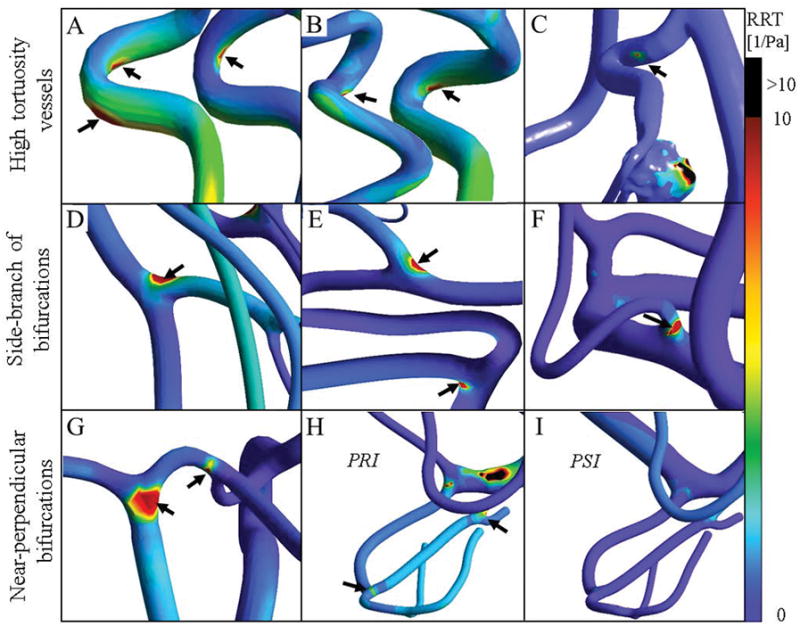
FIGURE 4.

Assessment of hemodynamic low-risk regions in healthy and pathological cases. Black arrows indicate low-risk regions with a high relative residence time (RRT). These locations also exhibited low-risk range of OSI and TAWSS (data not shown). (A–B) Internal carotid arteries with high tortuosity exhibit hemodynamic risky regions mostly in the inner curve of the carotid siphon of subject II, and subject IV. (C) The downstream artery of the aneurysm exhibits a low-risk area at the point of high curvature. (D–F) High RRT regions were observed at bifurcations with daughter branches of different diameter ratios in subject III and subject VI. (G) The walls of thinner side branches are more prone to atherosclerosis as indicated by the hemodynamic parameters. In subject I, low-risk regions were found to be located at near perpendicular-bifurcations such as the junction of PCOM and PCA and the basilar tip. High-velocity blood flow impinges on the opposite arterial wall in near perpendicular bifurcations. (H) High-velocity blood flow jets generate risky areas in the downstream vessels in stenosis case (PRI). (I) Risky regions in the patient shown in panel H were remedied after treatment (PSI).
