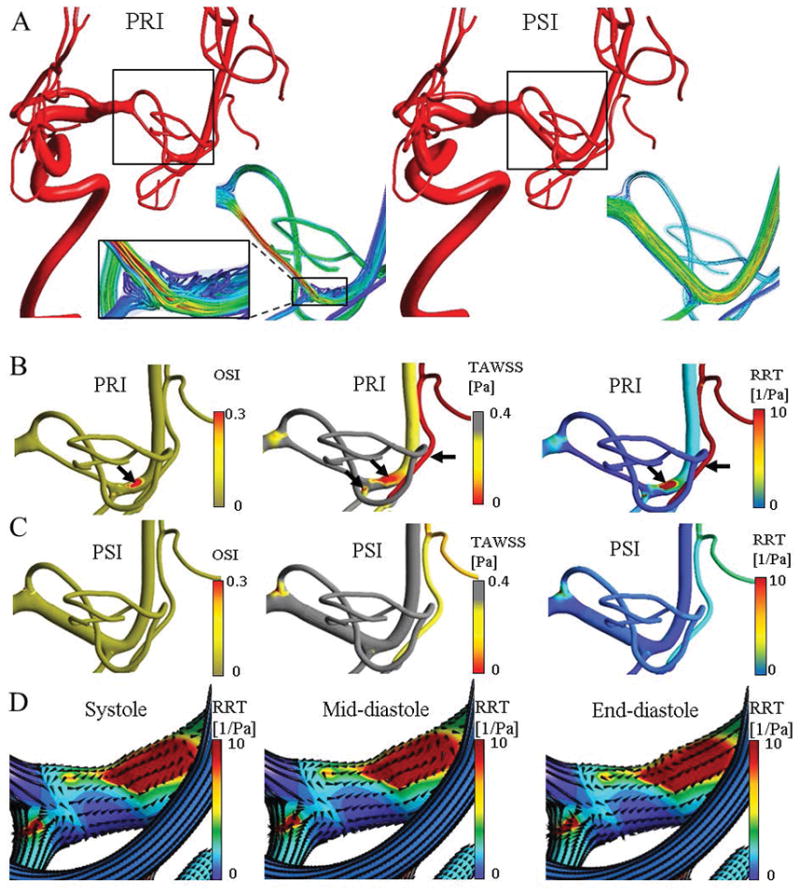
FIGURE 6.

Disturbed flow quantification and high-risk region detection for an illustrative case in a patient with MCA stenosis. Panel (A) illustrates the reconstructed model with high-density blood flow streamline in pre-intervention (PRI) and post-intervention (PSI) at peak-systole. In PRI, the magnified view visualized the disturbed flow circulation at post stenosis region. (B) Disturbed flow generated regions with relative high OSI and low TAWSS, i.e. high RRT. Note that the scale is inverted for TAWSS to highlight the risky regions. Black arrows indicates the high-risk locations at post-stenosis and distal down-stream vessel. (C) After angioplasty, it showed the normalization of the high RRT segments both proximal and distal to the stenosis (red RTT zones). Panel (D) visualize the normalized wall shear stress vectors on disturbed flow regions in systole, mid-diastole, and end-diastole. Most changes are between mid to end-diastole.
