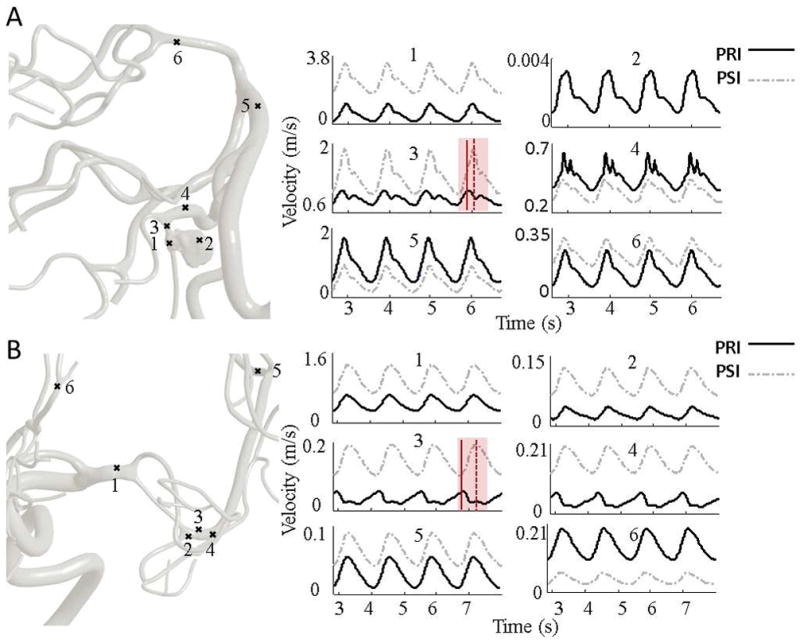
FIGURE 7.

Computed blood flow velocity for the MCA stenosis illustrative case in pre- and post-intervention (PRI and PSI). Panel (A) visualizes dynamic velocity profiles at different locations starting from the proximal to distal vessels. The transparent red area highlights the largest phase lag. In aneurysm case, a very low velocity of stagnated flow was recorded close to high RRT at point 2. In the post-aneurysm region, points 3 and 4, there was a phase lag and an augmentation of the secondary peak compared to the PSI. The angular phase shift between PRI and PSI are 38.82° and 10.58° at points 3 and 4, respectively. Panel (B) visualized the dynamic velocity profile at pre-stenosis, 1, post-stenosis, 2–4, downstream MCA vessel, 5 and downstream ACA territory, 6 of the stenosis patient in pre-intervention (PRI) and post-intervention (PSI). Red solid and dotted line represent the maximum systolic velocity at PRI and PSI, respectively. The phase shift between the PRI and PSI in poststenotic region (points 3 and 4) are 106.05° and 78.14°, respectively. The global blood flow analysis revealed a phase lag of 11.16° in distal MCA vessels (point 5).
