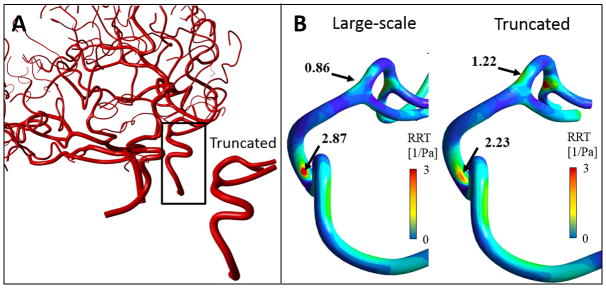
FIGURE A.2.
Hemodynamic risk-factor analysis of large-scale and truncated cerebrovascular tree. (A) A small section of Subject II’s cerebroarterial tree with five segments from the RICA to RMCA was truncated. Dynamic pressure profile was extracted from the large-scale model at three outlets and was used them as pressure boundary condition for the truncated model. (B) Distribution of relative residual time (RRT) of the truncated and large-scale vascular tree were different. The major different regions with the elevated RRT values are shown with black arrows. Predicted RRT map varied widely between small and large-scale models despite “correct” pressure outlet.

