Figure 1.
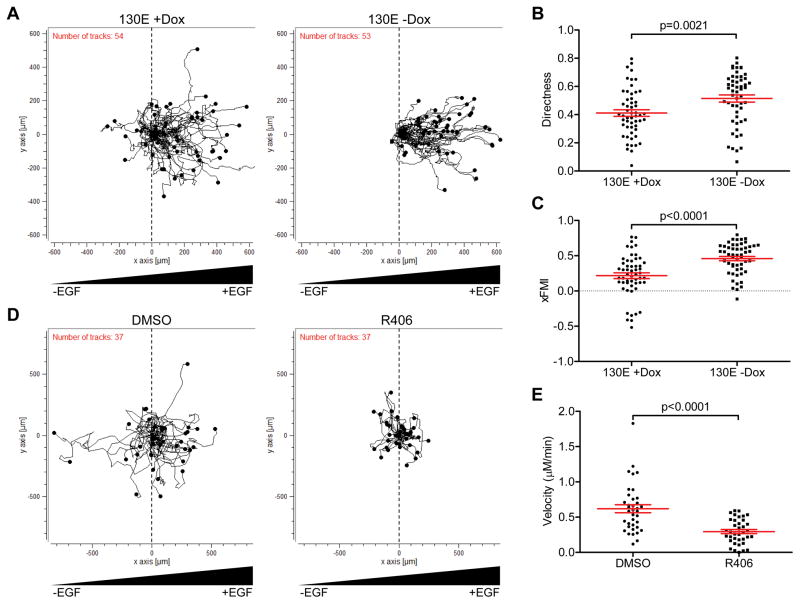
Expression of active SYK increases directed migration toward increasing EGF. A–C. Trajectories of SKOV3 cells seeded into EGF gradients on chemotaxis microscope slides. A. (left) Migration in the absence of active SYK130E (+Dox). (right) Migration in the presence of constitutively active SYK130E mutant (−Dox). B. Scatter plot quantitation of EGF-directed cell movement. C. Scatter plot quantitation of xFMI (x-axis Forward Migration Index). D. Trajectories of SKOV3 cells in EGF gradients in the presence of solvent (DMSO) control (left) or in the presence of SYK inhibitor (R406) (right). E. Scatter plot quantitation of R406 effects on the velocity of cell movement. Results are shown as mean ± SEM. Statistical evaluation were performed using two-tailed Mann-Whitney test.

