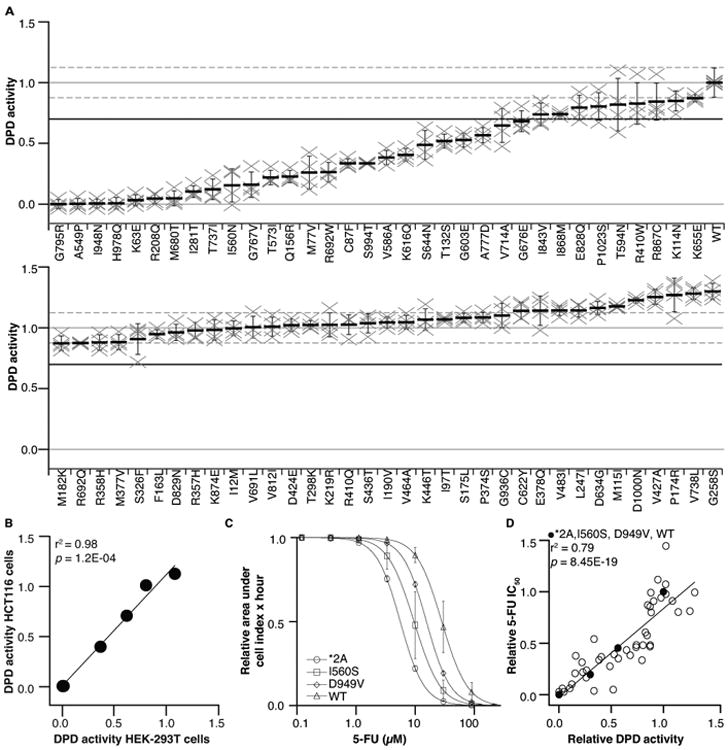
Figure 1. In vitro characterization of DPYD missense variants.

A. In vitro DPD activity was measured for 69 DPYD variants. Each “×” represents an independent biological replicate that is the mean of three technical replicates. The mean of four biological replicates is presented as a horizontal bar ± SD. The mean relative activity for wildtype DPD is presented as a horizontal solid gray line (crossing vertical axis at 1.0); the mean SD range for wildtype DPD is presented as dashed gray lines. The 70% threshold separating deleterious and neutral variants is presented as a solid black line. B. DPD activity of variants expressed in HEK-293T and HCT116 cells was positively correlated. C. 5-FU dose response was measured for cells expressing the indicated variants. Data points represent the mean ± SD from three independent experiments. D. In vitro DPD activity correlated with in vivo 5-FU sensitivity.
