
Figure 4. Performance of the DPYD-specific classifier.
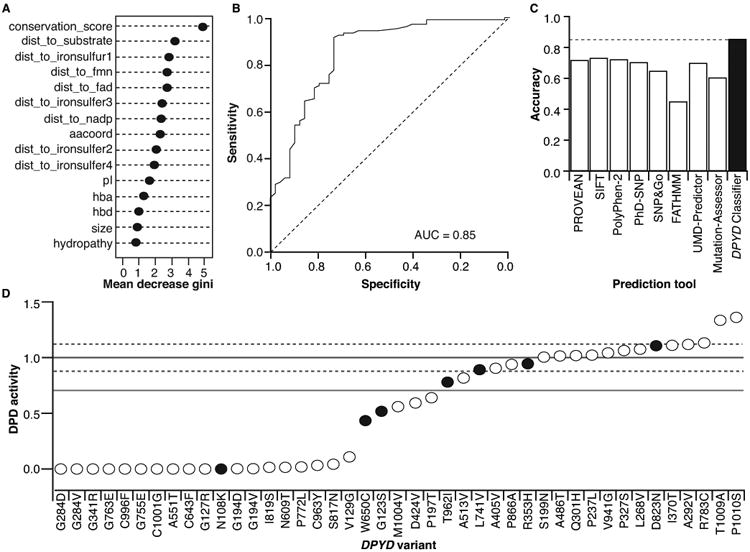
A. The importance of the 15 features utilized in the DPYD classifier is presented as the mean decrease in Gini coefficient. B. An ROC curve was generated for DPYD-Varifier predictions. C. The accuracy of DPYD-Varifier was assessed relative to other prediction tools. D. DPD activity was measured for 43 variants in an independent validation set. The activity of variants that matched DPYD-Varifier prediction is presented as open circles; the activity of variants that did not match the prediction is presented as closed black circles. The mean relative activity and SD for wildtype DPD are presented as solid and dashed gray lines, respectively. The 70% threshold separating deleterious and neutral variants is presented as a solid black line.