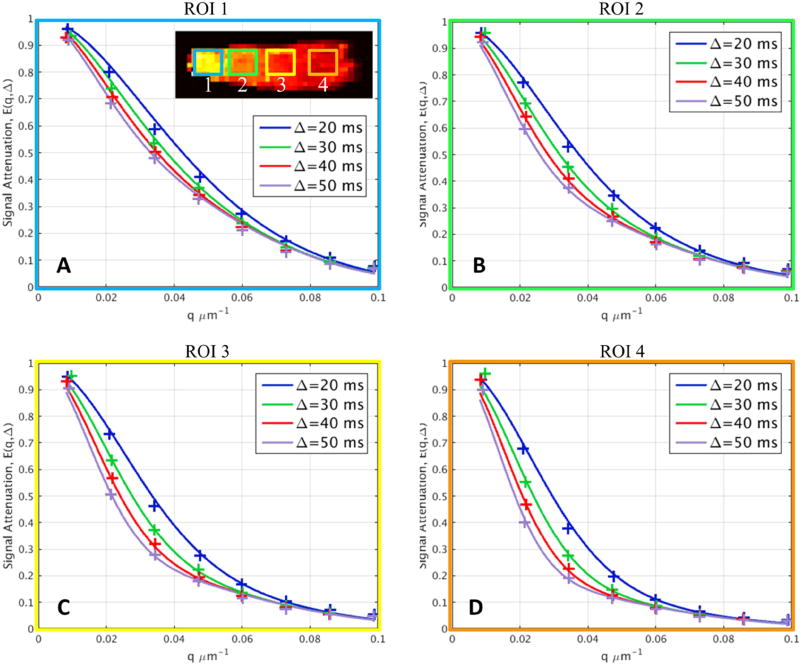
Figure 6.
Diffusion signal decays in regions of interest (inset) with different packing densities along the length of the fiber bundle. The measured perpendicular signal was averaged across the three central slices within the ROIs illustrated in (A) and were plotted against q-value. The predicted signals using the three-compartment model were plotted as superimposed curves upon the experimental data points. There is clear difference between different portions of the phantom with different packing densities. The signal model fits the data well, indicating that the signal model used here can capture the trends in the experimental data without visible discrepancies between the measured data and model-predicted signals.

