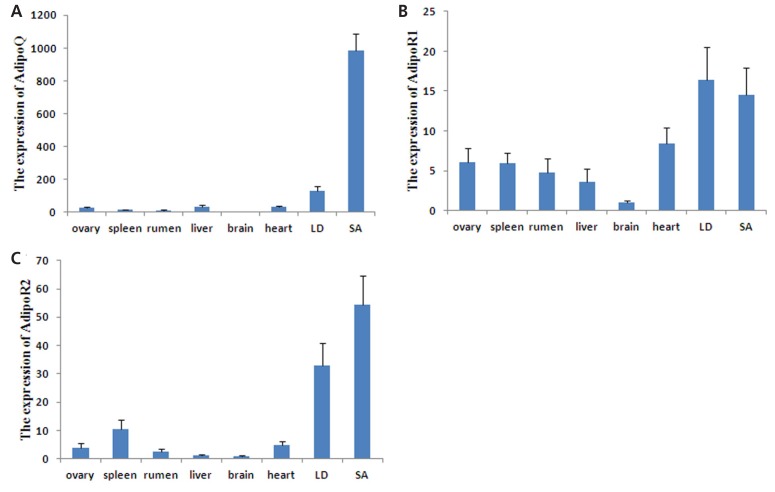
Figure 3.
mRNA expression levels of AdipoQ, AdipoR1, and AdipoR2 in different tissues were determined by quantitative polymerase chain reaction. The samples represent the longissimus dorsi muscle (LD) and subcutaneous adipose (SA) tissue. The bars represent the mean±standard error of the mean. (n = 3); β-actin was used as a control. AdipoQ, adiponectin; AdpoR, adiponectin receptor.

