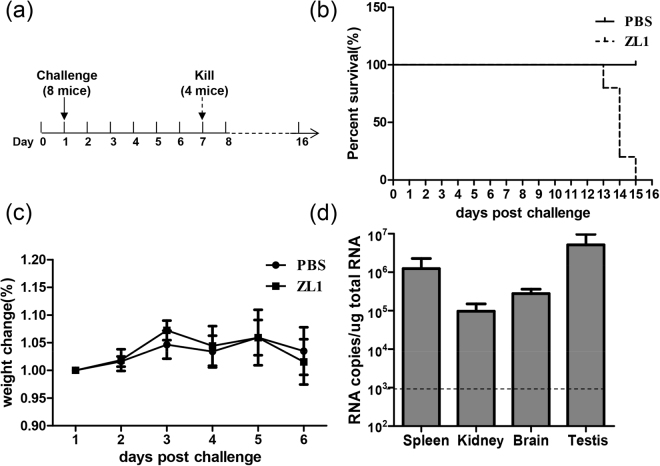
Figure 3.
Virulence of Rescued ZL1 virus in the AG6 mice. (a) Schematic diagram of process of challenge in AG6 mice. 10-week-old AG6 mice were inoculated by intraperitoneal injection with 100PFU (n = 8), the infected mice were monitored for weight loss, and then, 4 mice were killed and several organs were collected at 6 days post infection for RNA analysis. (b) Survival rate of infected mice after inoculation with 100 PFU ZL1 virus. (c) Weights were obtained over 6 days and expressed as a percentage of starting weight. (d) RNA level in different organs of infected mice (n = 4). Several organs were collected at 6 days post infection, after RNA extraction from these organs, RNA copies were detected by q-RT-PCR. Data represent the means of 4 mice; error bars represent standard deviations from the means.

