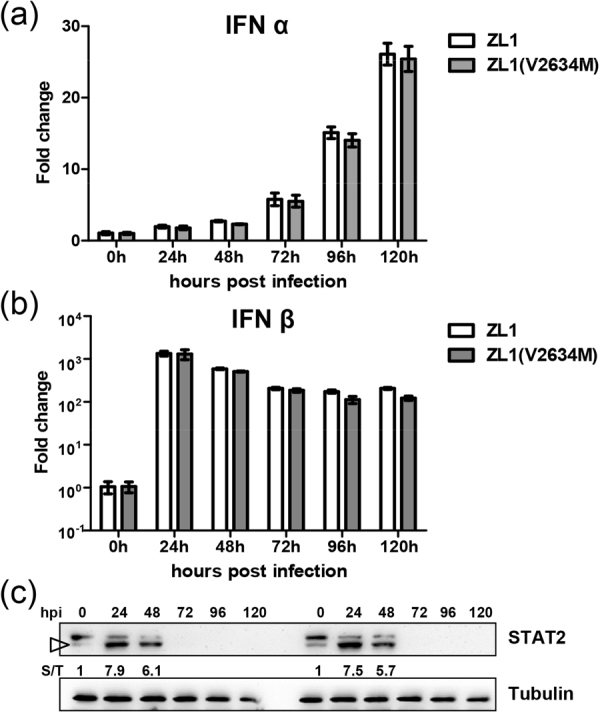
Figure 8.

Comparison of IFN responses between wild type ZL1 and ZL1(V2634M). (a/b) Analysis of type I IFN responses in A549 cells. A549 cells were infected with ZL1 and ZL1(V2634M) virus(MOI = 0.01). Cell lysis were harvested at 0 h, 24 h, 48 h, 72 h, 96 h, 120 h post infection. IFNα/β RNA was detected by q-RT-PCR. Data represent the means of three independent assays; Error bars represent standard deviations from the means. (c) Western blot analysis of ZIKV NS5-induced STAT2 degradation in Vero E6. Vero E6 cells were infected with ZL1 and ZL1(V2634M) virus(MOI = 0.01). Cell pellets harvested at hours 0, 24, 48, 72, 96 h, 120 h post infection were detected by using anti-STAT2 antibody. Numbers indicate relative band intensity (STAT2/Tubulin, S/T) and targeted band for densitometry were indicated by triangle.
