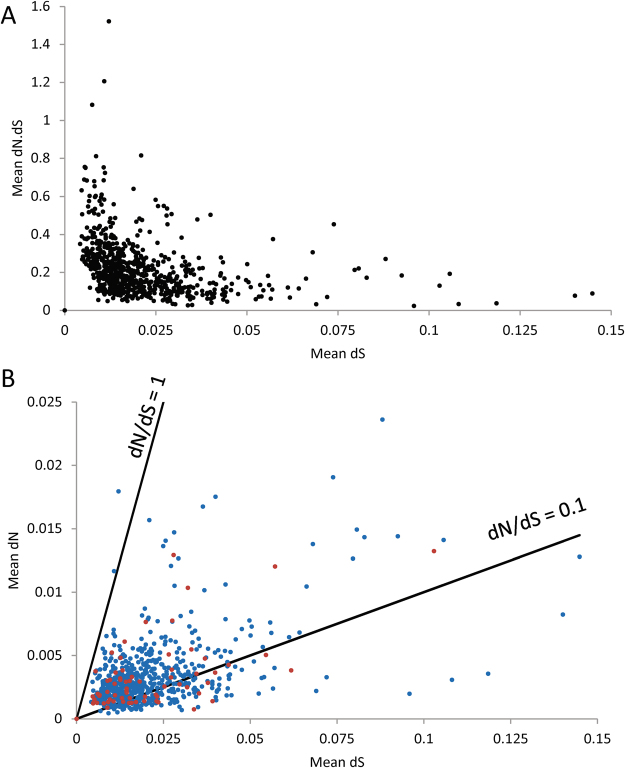
Figure 3.
Output of assessment of strength and direction of selection on chromosomal genes. (A) A plot of pairwise dN/dS versus divergence time (dS) over all chromosomal genes. (B) A plot of dN versus dS for all chromosomal genes. Those genes encoding surface exposed proteins, or other genes which are putatively immunogenic (see Table S2) are shown in blue, all other genes are shown in red. The lines represent two interpretations of the neutral expectation (dN/dS = 1 and 0.1). The single gene with dN/dS > 1 is rpsH which encodes a ribosomal protein hence would be expected to be under strong stabilising selection.

