Figure 2.

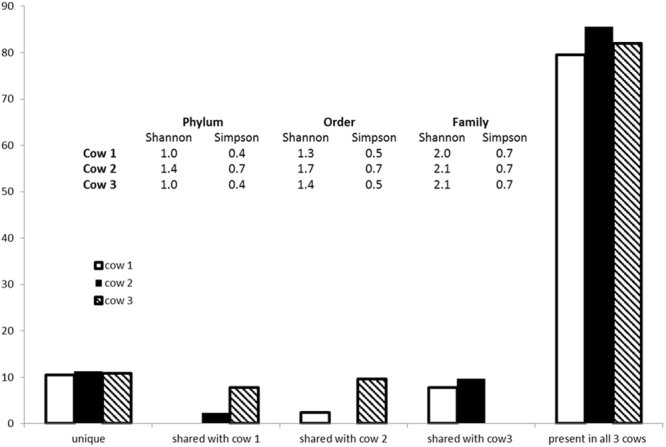
Percentage of overlap of protein families shared and unique between each cow replicate and table of the Shannon and Simpson diversity index comparing each cow in terms of taxonomy based on Phylum, Order and Family levels.

Percentage of overlap of protein families shared and unique between each cow replicate and table of the Shannon and Simpson diversity index comparing each cow in terms of taxonomy based on Phylum, Order and Family levels.